Exploratory Data Analysis (EDA)
End-to-End Machine Learning: Titanic Survival Prediction
1 min read
This section is 1 min read, full guide is 12 min read
Published Nov 18 2025
10
Show sections list
0
Log in to enable the "Like" button
0
Guide comments
0
Log in to enable the "Save" button
Respond to this guide
Guide Sections
Guide Comments
KerasMachine LearningMatplotlibNumPyPandasPythonscikit-learnSciPySeabornTensorFlow
Before building models, we explore the data. EDA helps validate assumptions, spot issues, and inspire feature engineering.
Overall survival rate
titanic["survived"].value_counts(normalize=True).plot(kind="bar")
plt.title("Overall Survival Rate")
plt.xticks([0, 1], ["Died", "Survived"])
plt.show()
Copy to Clipboard
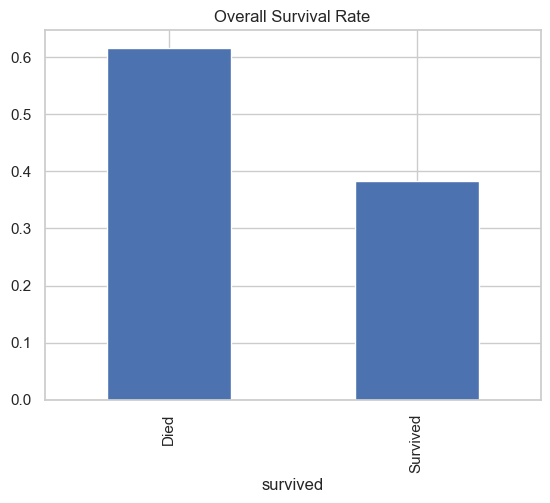
Roughly 38% survived, reflecting historical reality.
Survival by gender
The famous “women and children first” rule should be visible:
sns.countplot(data=titanic, x="sex", hue="survived")
plt.title("Survival by Sex")
plt.show()
Copy to Clipboard
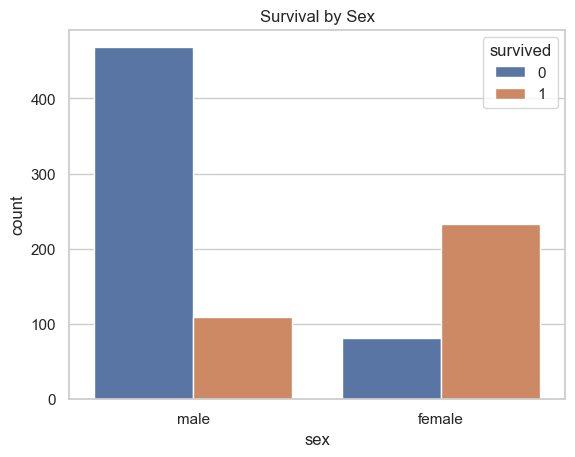
Women clearly survived at a far higher rate than men.
Survival by class
sns.countplot(data=titanic, x="pclass", hue="survived")
plt.title("Survival by Passenger Class")
plt.show()
Copy to Clipboard
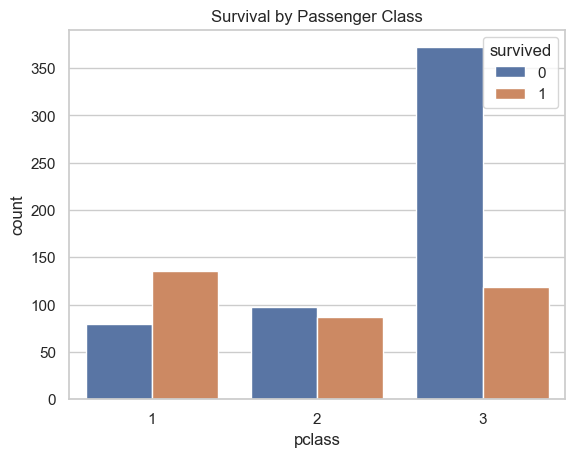
First class passengers enjoyed significantly higher survival chances, reflecting social and physical advantages (cabin location, priority access to lifeboats, etc.).
Age distribution
sns.kdeplot(data=titanic, x="age", hue="survived", common_norm=False)
plt.title("Age Distribution by Survival")
plt.show()
Copy to Clipboard
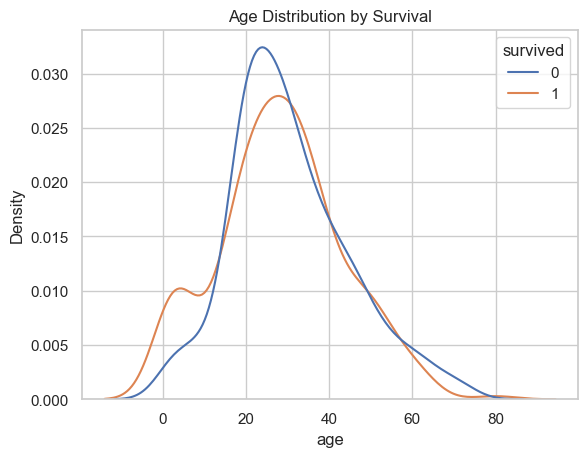
Children appear to have somewhat different survival patterns.
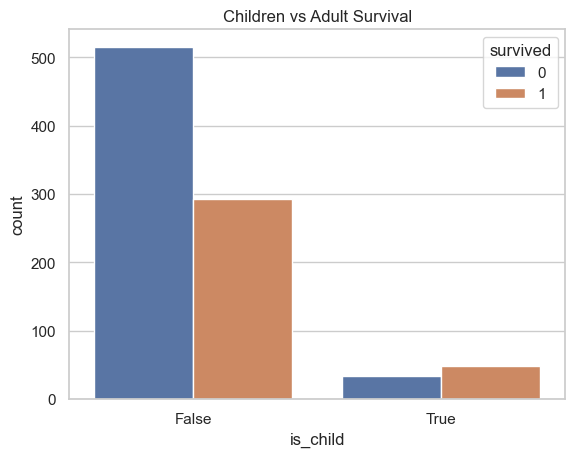
We can create an explicit child flag:
titanic["is_child"] = titanic["age"] < 16
sns.countplot(data=titanic, x="is_child", hue="survived")
plt.title("Children vs Adult Survival")
plt.show()
Copy to Clipboard
Products from our shop
Docker Cheat Sheet - Print at Home Designs

Docker Cheat Sheet Mouse Mat

Docker Cheat Sheet Travel Mug

Docker Cheat Sheet Mug
Vim Cheat Sheet - Print at Home Designs

Vim Cheat Sheet Mouse Mat

Vim Cheat Sheet Travel Mug

Vim Cheat Sheet Mug

SimpleSteps.guide branded Travel Mug

Developer Excuse Javascript - Travel Mug

Developer Excuse Javascript Embroidered T-Shirt - Dark

Developer Excuse Javascript Embroidered T-Shirt - Light

Developer Excuse Javascript Mug - White

Developer Excuse Javascript Mug - Black

SimpleSteps.guide branded stainless steel water bottle

Developer Excuse Javascript Hoodie - Light
