Model Comparison & Conclusion
End-to-End Machine Learning: Titanic Survival Prediction
2 min read
This section is 2 min read, full guide is 12 min read
Published Nov 18 2025
10
Show sections list
0
Log in to enable the "Like" button
0
Guide comments
0
Log in to enable the "Save" button
Respond to this guide
Guide Sections
Guide Comments
KerasMachine LearningMatplotlibNumPyPandasPythonscikit-learnSciPySeabornTensorFlow
Final Model Metrics
We print metrics side-by-side:
print("=== Model Comparison ===")
print("Logistic Regression - Acc: %.3f, AUC: %.3f" % (accuracy_score(y_test, pred_lr), roc_auc_score(y_test, prob_lr)))
print("Random Forest - Acc: %.3f, AUC: %.3f" % (accuracy_score(y_test, pred_rf), roc_auc_score(y_test, prob_rf)))
print("Keras Neural Network - Acc: %.3f, AUC: %.3f" % (accuracy_score(y_test, pred_keras), roc_auc_score(y_test, prob_keras)))
Copy to Clipboard
Output:
=== Model Comparison ===
Logistic Regression - Acc: 0.832, AUC: 0.870
Random Forest - Acc: 0.821, AUC: 0.837
Keras Neural Network - Acc: 0.810, AUC: 0.859
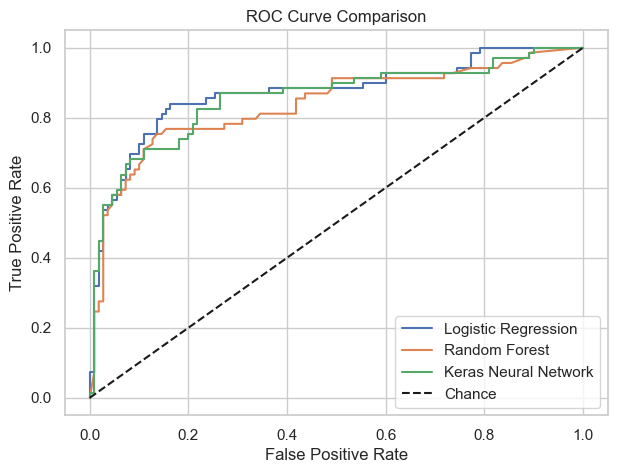
ROC Curves combined
plt.figure(figsize=(7, 5))
# Logistic Regression
fpr_lr, tpr_lr, _ = roc_curve(y_test, prob_lr)
plt.plot(fpr_lr, tpr_lr, label="Logistic Regression")
# Random Forest
fpr_rf, tpr_rf, _ = roc_curve(y_test, prob_rf)
plt.plot(fpr_rf, tpr_rf, label="Random Forest")
# Keras
fpr_k, tpr_k, _ = roc_curve(y_test, prob_keras)
plt.plot(fpr_k, tpr_k, label="Keras Neural Network")
plt.plot([0, 1], [0, 1], "k--", label="Chance")
plt.xlabel("False Positive Rate")
plt.ylabel("True Positive Rate")
plt.title("ROC Curve Comparison")
plt.legend()
plt.show()
Copy to Clipboard
Toggle show comments
What This Means (Interpretation)
I put the results in to ChatGPT, this is the response:
Logistic Regression performed the best overall.
This is very common on small, structured, tabular datasets like Titanic.
Because:
- Relationships are mostly linear/logistic
- Feature interactions are simple
- Categorical variables carry strong signal (sex/class)
- Data is low dimensional
- The dataset is small (≈700 usable rows after cleaning)
Logistic regression shines in exactly these conditions.
Random Forest performed slightly worse than logistic regression.
This also makes sense:
- Titanic has limited signal; throwing large trees at it doesn’t uncover new structure.
- RF still performs well, showing it captures some nonlinearities, but not enough to beat logistic regression.
Your results show:
- RF accuracy is slightly lower
- RF ROC-AUC is appreciably lower - Meaning it’s less good at ranking survivors vs non-survivors.
The Keras neural network performed better than RF in AUC but worse than logistic regression.
Again: completely normal.
Reasons neural networks do not dominate here:
- Neural nets need lots of data (thousands+, ideally tens of thousands).
- Titanic has under 1k usable rows after cleaning.
- Most signal is “easy” (sex & class), so a small NN doesn’t extract more than logistic regression already does.
- Neural nets struggle when:
- input dimensionality is low
- dataset is small
- features are tabular (not images or text)
Still, your NN’s ROC-AUC (0.859) is very respectable, meaning it ranks individuals reasonably well despite less accuracy.
Final conclusions
- Hypotheses confirmed statistically: women, children, and first-class passengers had significantly higher survival rates.
- EDA visualisations clearly support these patterns.
- Statistical tests (chi-square, t-test) confirm survival was not random and was influenced by demographic variables.
- Scikit-learn models give strong performance out-of-the-box with Logistic Regression the best performer. Random Forest captures complex patterns effectively.
- Keras model performs well but does not drastically outperform Random Forest — typical for small tabular datasets.
Products from our shop
Docker Cheat Sheet - Print at Home Designs

Docker Cheat Sheet Mouse Mat

Docker Cheat Sheet Travel Mug

Docker Cheat Sheet Mug
Vim Cheat Sheet - Print at Home Designs

Vim Cheat Sheet Mouse Mat

Vim Cheat Sheet Travel Mug

Vim Cheat Sheet Mug

SimpleSteps.guide branded Travel Mug

Developer Excuse Javascript - Travel Mug

Developer Excuse Javascript Embroidered T-Shirt - Dark

Developer Excuse Javascript Embroidered T-Shirt - Light

Developer Excuse Javascript Mug - White

Developer Excuse Javascript Mug - Black

SimpleSteps.guide branded stainless steel water bottle

Developer Excuse Javascript Hoodie - Light
