Preparing the Data
Machine Learning Fundamentals with Python
2 min read
Published Nov 16 2025, updated Aug 17 2026
Guide Sections
Guide Comments
Machine learning starts and ends with data. Before training a model, we need to load, inspect, clean, and prepare the dataset so it’s suitable for algorithms to learn from.
Why Data Preparation Matters
A famous saying in ML:
“Garbage in → garbage out.”
Even the most advanced models will perform poorly if the data is messy, inconsistent, or incorrectly formatted.
Most of your time in real ML projects (often 60–80%) is spent on data preparation and exploration.
Loading Data
Data can come from CSV files, databases, or APIs.
Example Python code loading the Iris dataset from Seaborn:
import pandas as pdimport seaborn as sns# Load Iris datasetdf = sns.load_dataset("iris")# Display first few rowsprint(df.head())# Check dataset shapeprint("\nShape of dataset:", df.shape)# Check column names and data typesprint("\nColumn info:")print(df.info())Explanation:
.head()shows the first few rows..info()reveals data types and missing values.
Exploring the Data (EDA)
Exploratory Data Analysis (EDA) helps you understand what’s in your dataset before you model it.
Look at summaries and distributions:
import pandas as pdimport seaborn as snsimport matplotlib.pyplot as plt# Load Iris datasetdf = sns.load_dataset("iris")# Basic statisticsprint(df.describe())# Pairplot: visualize relationships between featuressns.pairplot(df, hue='species')plt.show()# Correlation heatmapplt.figure(figsize=(6,4))sns.heatmap(df.select_dtypes(include="number").corr(), annot=True, cmap="coolwarm")plt.title("Feature Correlation Heatmap")plt.tight_layout()plt.show()Explanation:
.describe()gives mean, std, min, max, etc.pairplot()helps visualise relationships between features.heatmap()shows how features are correlated (linear relationships).
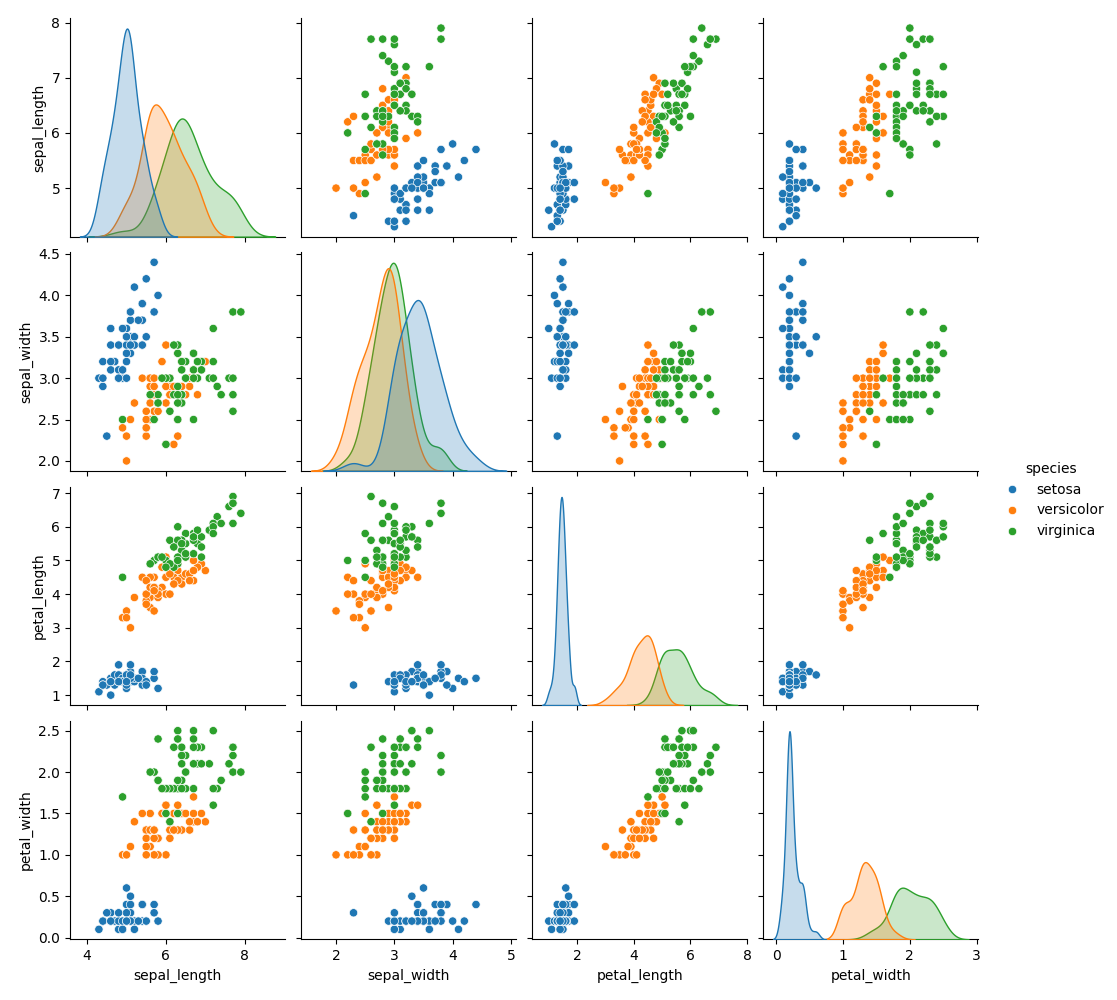
Pairplot of Iris dataset
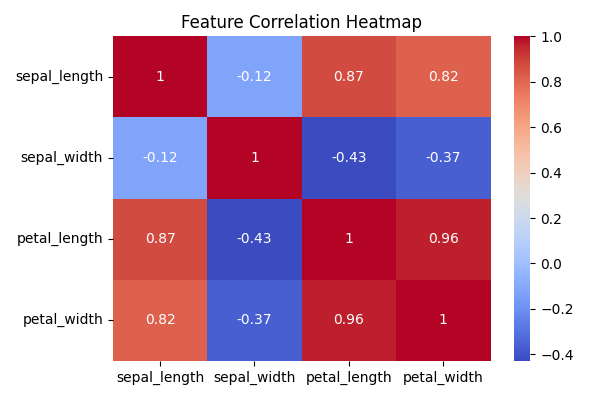
Heatmap of Iris dataset
Handling Missing Data
Datasets often have missing or invalid values. You can either remove or fill them.
# Check for missing valuesprint("Missing values per column:")print(df.isnull().sum())# Drop rows with missing valuesdf_clean = df.dropna()# Or fill missing values with the meandf_filled = df.fillna(df.mean(numeric_only=True))Explanation:
dropna()removes missing rows.fillna()replaces missing values (e.g., with mean or median).- Always inspect the effect before choosing a method.
Encoding Categorical Data
Machine learning models work with numbers, not text. We must convert categorical (string) data into numeric form.
# Example: encoding 'species' column into numeric labelsfrom sklearn.preprocessing import LabelEncoderencoder = LabelEncoder()df['species_encoded'] = encoder.fit_transform(df['species'])print(df[['species', 'species_encoded']].head())Explanation:
LabelEncoderconverts text labels, e.g. "setosa", "versicolor", "virginica" into numeric codes 0, 1, 2.- For non-ordered categories, you can also use one-hot encoding (
pd.get_dummies()):
# One-hot encoding exampledf_onehot = pd.get_dummies(df, columns=['species'])print(df_onehot.head())Feature Scaling
Some algorithms (e.g., K-Means, SVM, Neural Networks) are sensitive to the scale of data. If one feature has much larger values than another, it can dominate the model’s learning.
Two common techniques:
- Standardisation: mean = 0, std = 1
- Normalisation: scales values between 0 and 1
from sklearn.preprocessing import StandardScaler, MinMaxScalerscaler_std = StandardScaler()scaler_minmax = MinMaxScaler()# Example: scale numeric columnsnumeric_cols = ['sepal_length', 'sepal_width', 'petal_length', 'petal_width']df_scaled_std = df.copy()df_scaled_std[numeric_cols] = scaler_std.fit_transform(df_scaled_std[numeric_cols])df_scaled_mm = df.copy()df_scaled_mm[numeric_cols] = scaler_minmax.fit_transform(df_scaled_mm[numeric_cols])print(df_scaled_std.head())Explanation:
StandardScalercenters and scales to unit variance.MinMaxScalerrescales between 0–1.- Scaling doesn’t change relationships, only value ranges.
Splitting Data into Train and Test Sets
We must train our model on part of the data and test it on unseen data to check generalisation.
from sklearn.model_selection import train_test_splitX = df_scaled_std.drop(columns=['species', 'species_encoded'])y = df_scaled_std['species_encoded']X_train, X_test, y_train, y_test = train_test_split( X, y, test_size=0.2, random_state=42)print("Training set size:", X_train.shape)print("Test set size:", X_test.shape)Explanation:
train_test_split()randomly divides the dataset.- Typically, 80% training / 20% testing is used.
- The test set simulates unseen data to measure performance objectively.