Five number summary and box plot
Maths: Statistics for machine learning
2 min read
Published Oct 22 2025, updated Oct 23 2025
Guide Sections
Guide Comments
The Five-Number Summary gives a quick overview of how data is spread.
It consists of five key descriptive statistics that summarise the distribution of a dataset. It is made up from five numbers that we have already covered in the previous sections.
The Five Values:
Statistic | Meaning | Description |
Minimum | The smallest value | The lowest observation in the data |
Q1 (First Quartile) | 25th percentile | 25% of the data fall below this value |
Median (Q2) | 50th percentile | The middle value (half the data above, half below) |
Q3 (Third Quartile) | 75th percentile | 75% of the data fall below this value |
Maximum | The largest value | The highest observation in the data |
Why It’s Useful
- Gives a summary of data distribution (centre, spread, and extremes).
- Helps identify outliers and skewness.
- Foundation for creating a box plot — a key data visualisation tool.
The Box Plot
A Box Plot (or Box-and-Whisker Plot) is a graphical representation of the five-number summary.
It shows the spread, centre, and outliers of a dataset.
Parts of a Box Plot
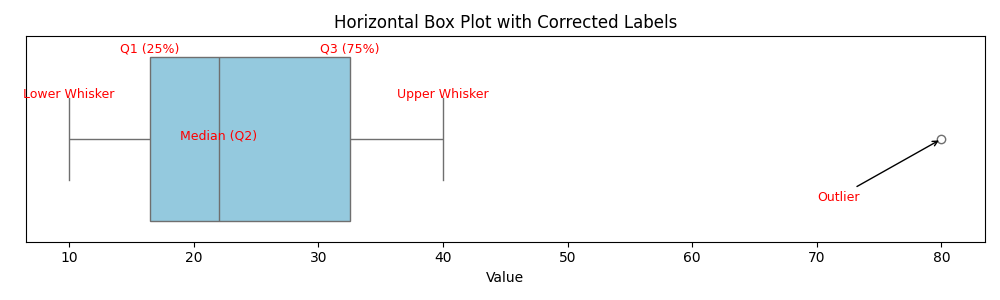
- The box spans from Q1 to Q3 (the interquartile range, IQR = Q3 - Q1).
- The line inside the box shows the median (Q2).
- The “whiskers” extend to the minimum and maximum values that are not outliers.
- Lower whisker: Q1 - (IQR * 1.5)
- Upper whisker: Q3 + (IQR * 1.5)
- Outliers (if any) are plotted as individual points beyond the whiskers.
Interpreting a Box Plot
- Long box → data are more spread out (high variability)
- Short box → data are clustered (low variability)
- Median near the top or bottom → skewed distribution
- Dots outside whiskers → possible outliers
Calculating in Python
Using NumPy:
Using Pandas describe():
Outputs:
Highlighted are the five number summary values (Min, Q1, Median, Q3, Max).
Products from our shop
Docker Cheat Sheet - Print at Home Designs

Docker Cheat Sheet Mouse Mat

Docker Cheat Sheet Travel Mug

Docker Cheat Sheet Mug
Vim Cheat Sheet - Print at Home Designs

Vim Cheat Sheet Mouse Mat

Vim Cheat Sheet Travel Mug

Vim Cheat Sheet Mug

SimpleSteps.guide branded Travel Mug

Developer Excuse Javascript - Travel Mug

Developer Excuse Javascript Embroidered T-Shirt - Dark

Developer Excuse Javascript Embroidered T-Shirt - Light

Developer Excuse Javascript Mug - White

Developer Excuse Javascript Mug - Black

SimpleSteps.guide branded stainless steel water bottle

Developer Excuse Javascript Hoodie - Light
