Log Normal Distribution
Maths: Statistics for machine learning
2 min read
This section is 2 min read, full guide is 105 min read
Published Oct 22 2025, updated Aug 17 2026
40
Show sections list
0
Log in to enable the "Like" button
0
Guide comments
0
Log in to enable the "Save" button
Respond to this guide
Guide Sections
Guide Comments
Machine LearningMathsNumPyPandasPythonStatistics
A Log-Normal Distribution models a random variable whose logarithm is normally distributed.
That is:

In simple terms:
If taking the log of your data makes it look Normal,
then your original data follow a Log-Normal Distribution.
Probability Density Function (PDF)
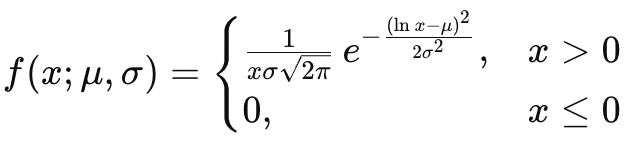
Where:
- μ = mean of the log-transformed variable (ln X)
- σ = standard deviation of the log-transformed variable
The total area under the curve = 1
Only defined for x > 0
Intuition
- The Normal distribution is symmetric → works well for additive effects.
- The Log-Normal distribution is skewed → models multiplicative effects (e.g., product of random factors).
If you multiply random variables, the result tends to be log-normal.
If you add random variables, the result tends to be normal.
Examples
- Income distribution - Most people earn near average, few earn much more, skewed right, all values > 0
- Stock prices - Compound percentage growth, price changes multiply over time
- Reaction times - Most are short, few long, positive and skewed
- Word frequencies - Few words are common, many are rare, power-law-like behavior
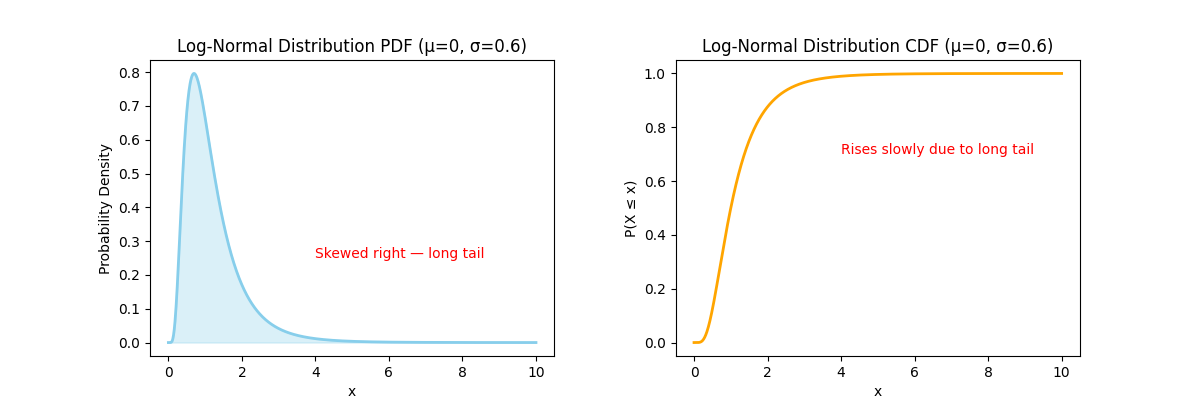
- Left plot (PDF):
- Skewed to the right (long tail)
- High probability near smaller x values, declining rapidly for larger x
- Right plot (CDF):
- Increases slowly at first, then approaches 1 as x grows
The shape is positively skewed
Defined only for x > 0
Effect of σ (Shape Parameter)
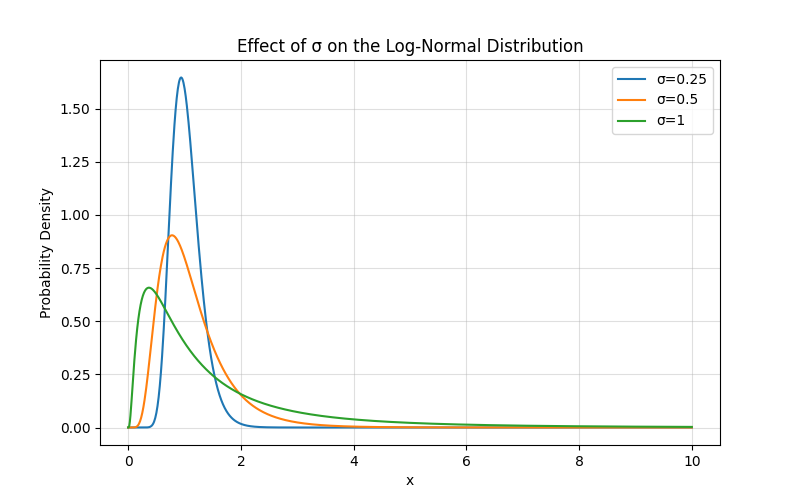
Smaller σ → curve is more concentrated (less skewed)
Larger σ → curve becomes more spread and heavily skewed right
In Machine Learning
- Modelling positive, skewed data - Income, prices, durations, transaction amounts
- Feature engineering - Taking log of skewed data often normalises it
- Probabilistic models - Log-normal likelihoods in regression or Bayesian models
- Finance - Stock price modelling under continuous compounding
- Simulation / Monte Carlo - Sampling multiplicative random processes