Measure of Central Tendency
Maths: Statistics for machine learning
3 min read
Published Oct 22 2025, updated Oct 23 2025
Guide Sections
Guide Comments
Measures of Central Tendency are statistical values that identify the centre or typical value of a dataset.
They describe where most data points tend to cluster and give a single value that best represents the entire dataset.
Why It Matters
- Helps summarise large datasets with one representative number.
- Provides a quick overview of data distribution.
- Used to compare datasets and identify trends.
- In machine learning, it’s often used in data exploration, normalisation, and feature understanding.
The Three Main Measures
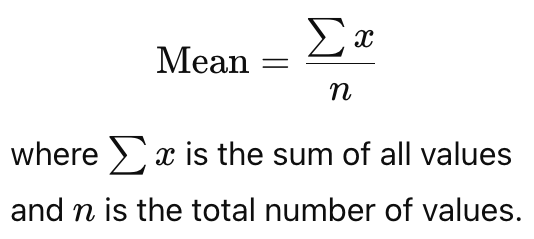
1. Mean (Arithmetic Average)
- Definition: The sum of all data values divided by the number of observations.
- Formula:
- Example:
- Data:
[4, 6, 8]so the mean = (4 + 6 + 8) ÷ 3 = 6
- Data:
- Notes:
- Sensitive to extreme values (outliers).
- Used for interval and ratio data.
2. Median (Middle Value)
- Definition: The middle value when all data points are arranged in order (ascending or descending).
- If the dataset has an even number of values, the median is the average of the two middle values.
- Example:
- Data:
[3, 5, 7, 9, 11]→ Median = 7 - Data:
[3, 5, 7, 9]→ Median = (5 + 7) ÷ 2 = 6
- Data:
- Notes:
- Unaffected by outliers, making it useful for skewed data.
- Suitable for ordinal, interval, and ratio data.
3. Mode (Most Frequent Value)
- Definition: The value that appears most frequently in a dataset.
- A dataset can have:
- One mode (unimodal),
- More than one mode (bimodal or multimodal), or
- No mode (if all values occur equally).
- Example:
- Data:
[2, 4, 4, 6, 8]→ Mode = 4
- Data:
- Notes:
- Works for nominal, ordinal, interval, and ratio data.
- Useful for categorical variables (e.g., most common product purchased).
Summary
Measure | Definition | Best for | Sensitive to Outliers? | Example (Data: 2, 4, 4, 6, 8) |
Mean | Average of all values | Interval/Ratio | Yes | 4.8 |
Median | Middle value when sorted | Ordinal/Interval/Ratio | No | 4 |
Mode | Most frequent value | Nominal/Ordinal | No | 4 |
In Machine Learning
- Used during exploratory data analysis (EDA) to understand feature distributions.
- The mean may be used for imputation of missing values.
- The median is preferred when data are skewed (e.g., income, house prices).
- The mode helps understand dominant categories in categorical data.
Calculating Mean, Median and Mode in Python
Using the statistics module (built-in):
Mode only works if there is a single mode value.
Using NumPy (for numerical arrays and larger datasets)
Mode returns an array of all modes.
Using Pandas (for data series)
Mode returns a data series of all modes.
Products from our shop
Docker Cheat Sheet - Print at Home Designs

Docker Cheat Sheet Mouse Mat

Docker Cheat Sheet Travel Mug

Docker Cheat Sheet Mug
Vim Cheat Sheet - Print at Home Designs

Vim Cheat Sheet Mouse Mat

Vim Cheat Sheet Travel Mug

Vim Cheat Sheet Mug

SimpleSteps.guide branded Travel Mug

Developer Excuse Javascript - Travel Mug

Developer Excuse Javascript Embroidered T-Shirt - Dark

Developer Excuse Javascript Embroidered T-Shirt - Light

Developer Excuse Javascript Mug - White

Developer Excuse Javascript Mug - Black

SimpleSteps.guide branded stainless steel water bottle

Developer Excuse Javascript Hoodie - Light
