3D Charts
Matplotlib Basics
1 min read
This section is 1 min read, full guide is 24 min read
Published Oct 5 2025
15
Show sections list
0
Log in to enable the "Like" button
0
Guide comments
0
Log in to enable the "Save" button
Respond to this guide
Guide Sections
Guide Comments
ChartsGraphsMatplotlibNumPyPandasPythonVisualisation
Matplotlib supports 3D plotting via the module mpl_toolkits.mplot3d.
You create a 3D Axes object by setting:
ax = plt.axes(projection='3d')
Copy to Clipboard
Then you can call 3D-specific methods like plot3D(), scatter3D(), plot_surface(), etc.
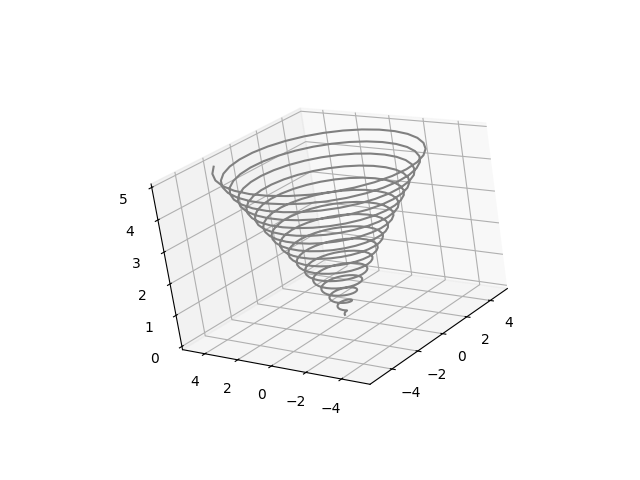
Line plot – ax.plot3D()
import matplotlib.pyplot as plt
import numpy as np
z = np.linspace(0, 5, 500)
x = z * np.sin(20 * z)
y = z * np.cos(20 * z)
fig = plt.figure()
ax = plt.axes(projection='3d')
ax.plot3D(x, y, z, 'gray')
plt.show()
Copy to Clipboard
Plots a 3D line connecting (x, y, z) points.
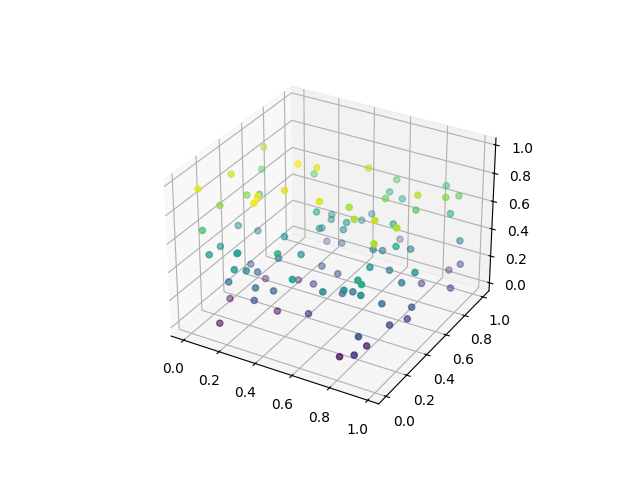
Scatter plot – ax.scatter3D()
import matplotlib.pyplot as plt
import numpy as np
x = np.random.rand(100)
y = np.random.rand(100)
z = np.random.rand(100)
colors = z
fig = plt.figure()
ax = plt.axes(projection='3d')
ax.scatter3D(x, y, z, c=colors, cmap='viridis')
plt.show()
Copy to Clipboard
Each point in 3D space can have its own color, size, and marker.
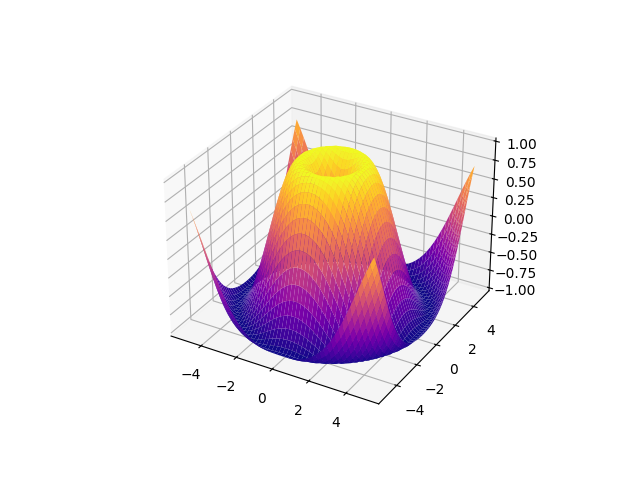
Surface plot – ax.plot_surface()
import matplotlib.pyplot as plt
import numpy as np
x = np.linspace(-5, 5, 50)
y = np.linspace(-5, 5, 50)
X, Y = np.meshgrid(x, y)
Z = np.sin(np.sqrt(X**2 + Y**2))
fig = plt.figure()
ax = plt.axes(projection='3d')
ax.plot_surface(X, Y, Z, cmap='plasma', edgecolor='none')
plt.show()
Copy to Clipboard
Visualises a continuous 3D surface over a grid.
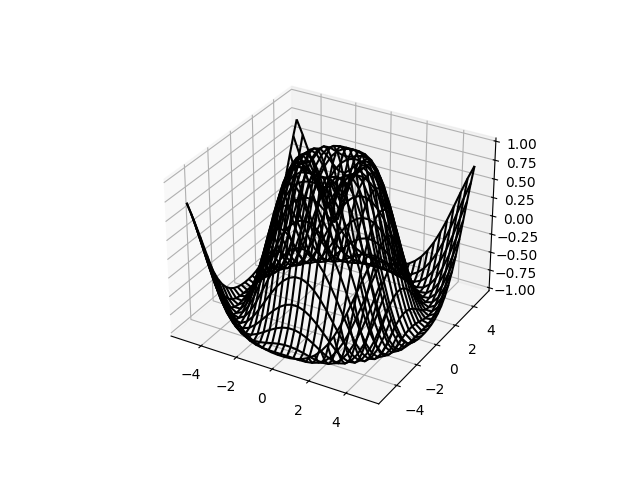
Wireframe plot – ax.plot_wireframe()
import matplotlib.pyplot as plt
import numpy as np
x = np.linspace(-5, 5, 30)
y = np.linspace(-5, 5, 30)
X, Y = np.meshgrid(x, y)
Z = np.sin(np.sqrt(X**2 + Y**2))
fig = plt.figure()
ax = plt.axes(projection='3d')
ax.plot_wireframe(X, Y, Z, color='black')
plt.show()
Copy to Clipboard
Same as surface plot but shows grid lines — great for structure visualisation.
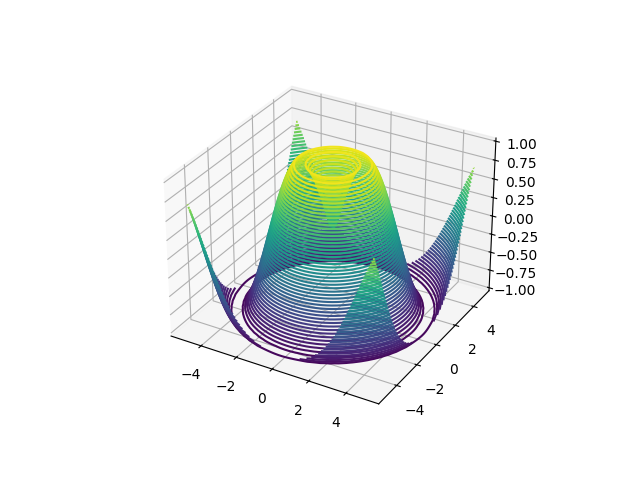
Contour plot (3D projection) – ax.contour3D()
import matplotlib.pyplot as plt
import numpy as np
x = np.linspace(-5, 5, 50)
y = np.linspace(-5, 5, 50)
X, Y = np.meshgrid(x, y)
Z = np.sin(np.sqrt(X**2 + Y**2))
fig = plt.figure()
ax = plt.axes(projection='3d')
ax.contour3D(X, Y, Z, 50, cmap='viridis')
plt.show()
Copy to Clipboard
Draws 3D contour lines (like elevation contours in a topographic map).
Useful Customisations
ax.set_title('3D Plot Example')
ax.set_xlabel('X axis')
ax.set_ylabel('Y axis')
ax.set_zlabel('Z axis')
# Change viewing angle
ax.view_init(elev=30, azim=45)
Copy to Clipboard
Toggle show comments
Products from our shop
Docker Cheat Sheet - Print at Home Designs

Docker Cheat Sheet Mouse Mat

Docker Cheat Sheet Travel Mug

Docker Cheat Sheet Mug
Vim Cheat Sheet - Print at Home Designs

Vim Cheat Sheet Mouse Mat

Vim Cheat Sheet Travel Mug

Vim Cheat Sheet Mug

SimpleSteps.guide branded Travel Mug

Developer Excuse Javascript - Travel Mug

Developer Excuse Javascript Embroidered T-Shirt - Dark

Developer Excuse Javascript Embroidered T-Shirt - Light

Developer Excuse Javascript Mug - White

Developer Excuse Javascript Mug - Black

SimpleSteps.guide branded stainless steel water bottle

Developer Excuse Javascript Hoodie - Light
