Bar charts - vertical
Matplotlib Basics
1 min read
This section is 1 min read, full guide is 24 min read
Published Oct 5 2025
15
Show sections list
0
Log in to enable the "Like" button
0
Guide comments
0
Log in to enable the "Save" button
Respond to this guide
Guide Sections
Guide Comments
ChartsGraphsMatplotlibNumPyPandasPythonVisualisation
The bar() function creates vertical bars.
Syntax:
plt.bar(x, height, width=0.8, bottom=None, color=None, edgecolor=None, label=None, alpha=1.0)
Copy to Clipboard
Parameters:
x→ x-axis positions or categoriesheight→ heights of the barswidth→ width of each bar (default0.8)bottom→ y-value at which bars start (default0)color→ bar fill colouredgecolor→ colour of the bar borderlabel→ legend labelalpha→ transparency (0 to 1)
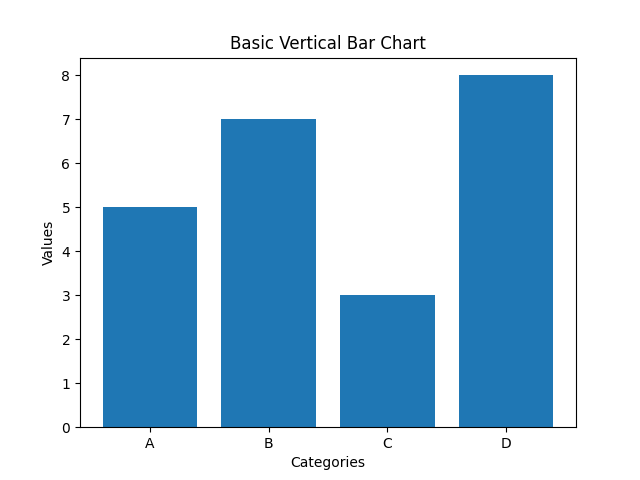
Basic example
import matplotlib.pyplot as plt
x = ['A', 'B', 'C', 'D']
y = [5, 7, 3, 8]
plt.bar(x, y)
plt.title("Basic Vertical Bar Chart")
plt.xlabel("Categories")
plt.ylabel("Values")
plt.show()
Copy to Clipboard
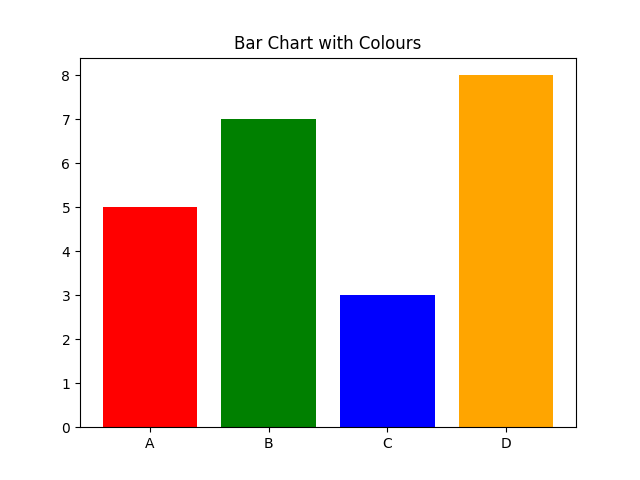
Customise bar colours
import matplotlib.pyplot as plt
x = ['A', 'B', 'C', 'D']
y = [5, 7, 3, 8]
colours = ['red', 'green', 'blue', 'orange']
plt.bar(x, y, color=colours)
plt.title("Bar Chart with Colours")
plt.show()
Copy to Clipboard
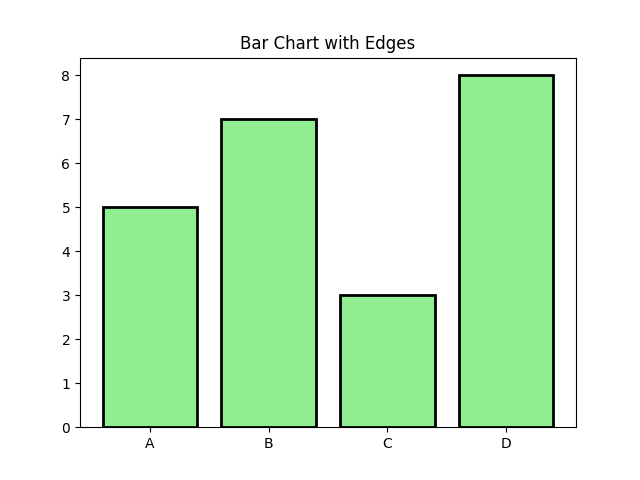
Add edge colour and width
import matplotlib.pyplot as plt
x = ['A', 'B', 'C', 'D']
y = [5, 7, 3, 8]
plt.bar(x, y, color='lightgreen', edgecolor='black', linewidth=2)
plt.title("Bar Chart with Edges")
plt.show()
Copy to Clipboard
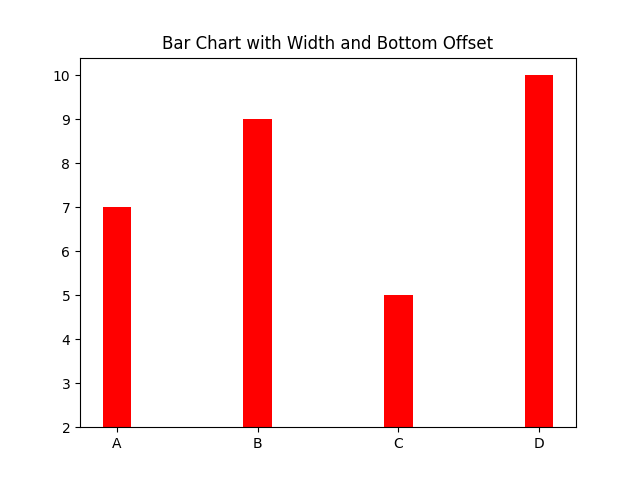
Bar width and bottom offset
import matplotlib.pyplot as plt
x = ['A', 'B', 'C', 'D']
y = [5, 7, 3, 8]
plt.bar(x, y, width=0.2, bottom=2, color='red')
plt.title("Bar Chart with Width and Bottom Offset")
plt.show()
Copy to Clipboard
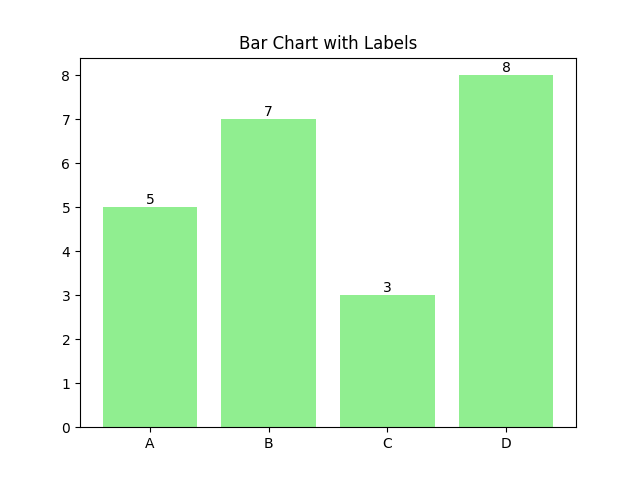
Add labels on top of the bars
import matplotlib.pyplot as plt
x = ['A', 'B', 'C', 'D']
y = [5, 7, 3, 8]
bars = plt.bar(x, y, color='lightgreen')
plt.title("Bar Chart with Labels")
for bar in bars:
plt.text(bar.get_x() + bar.get_width()/2, bar.get_height(),
str(bar.get_height()), ha='center', va='bottom')
plt.show()
Copy to Clipboard
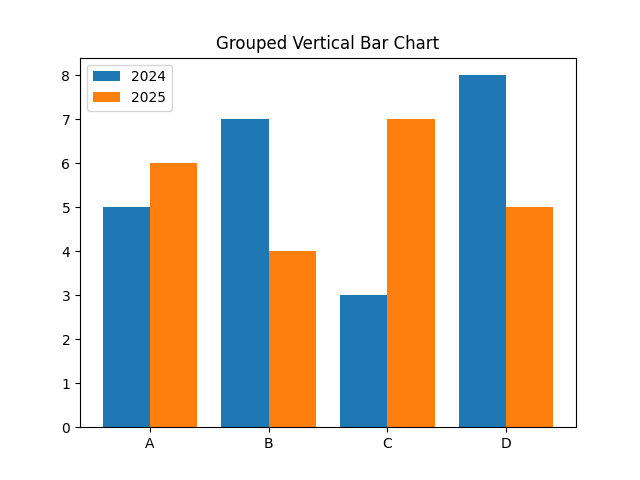
Grouped bar chart
import matplotlib.pyplot as plt
import numpy as np
x = np.arange(4)
y1 = [5, 7, 3, 8]
y2 = [6, 4, 7, 5]
plt.bar(x - 0.2, y1, width=0.4, label='2024')
plt.bar(x + 0.2, y2, width=0.4, label='2025')
plt.xticks(x, ['A','B','C','D'])
plt.legend()
plt.title("Grouped Vertical Bar Chart")
plt.show()
Copy to Clipboard
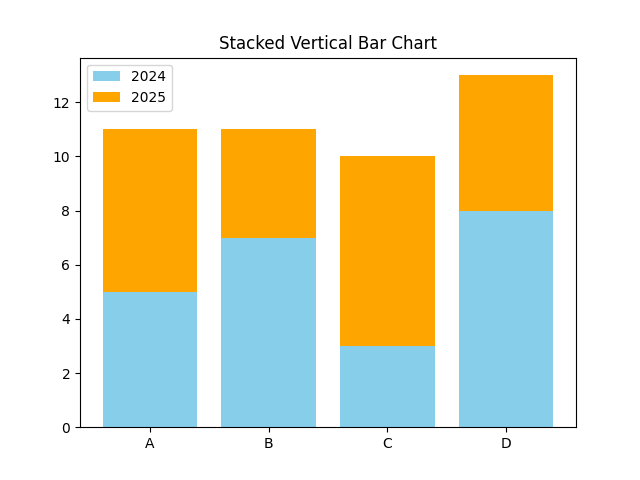
Stacked bar chart
import matplotlib.pyplot as plt
import numpy as np
x = np.arange(4) # positions
y1 = [5, 7, 3, 8]
y2 = [6, 4, 7, 5]
plt.bar(x, y1, label='2024', color='skyblue')
plt.bar(x, y2, bottom=y1, label='2025', color='orange')
plt.xticks(x, ['A','B','C','D'])
plt.legend()
plt.title("Stacked Vertical Bar Chart")
plt.show()
Copy to Clipboard
Products from our shop
Docker Cheat Sheet - Print at Home Designs

Docker Cheat Sheet Mouse Mat

Docker Cheat Sheet Travel Mug

Docker Cheat Sheet Mug
Vim Cheat Sheet - Print at Home Designs

Vim Cheat Sheet Mouse Mat

Vim Cheat Sheet Travel Mug

Vim Cheat Sheet Mug

SimpleSteps.guide branded Travel Mug

Developer Excuse Javascript - Travel Mug

Developer Excuse Javascript Embroidered T-Shirt - Dark

Developer Excuse Javascript Embroidered T-Shirt - Light

Developer Excuse Javascript Mug - White

Developer Excuse Javascript Mug - Black

SimpleSteps.guide branded stainless steel water bottle

Developer Excuse Javascript Hoodie - Light
