Line charts
Matplotlib Basics
2 min read
Published Oct 5 2025
Guide Sections
Guide Comments
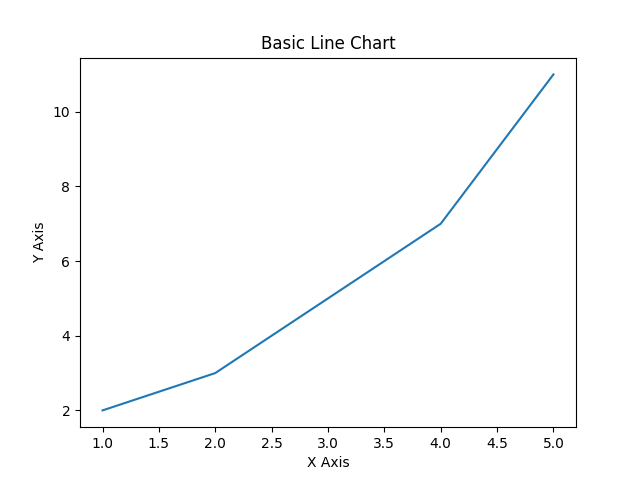
A line chart connects data points with straight lines, typically used to show trends over time or continuous relationships between variables.
Syntax:
Parameters:
x= sequence of x-valuesy= sequence of y-valuesfmt(optional) = a shorthand string that defines:- line style (
-,--,-.,:) - marker (
o,s,^, etc.) - colour (
r,g,b, etc.)
- line style (
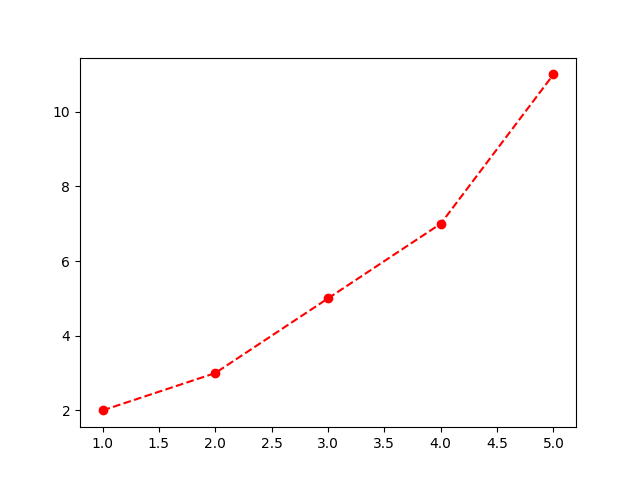
Example:plt.plot(x, y, 'ro--') means:
r = red, o = circle marker, -- = dashed line
Basic example
Line format shorthand
Optional shorthand way of formatting the line and markers.
Shorthand options:
Symbol | Meaning | Example |
| solid line |
|
| dashed line |
|
| dash-dot line |
|
| dotted line |
|
| circle marker |
|
| square marker |
|
| triangle marker |
|
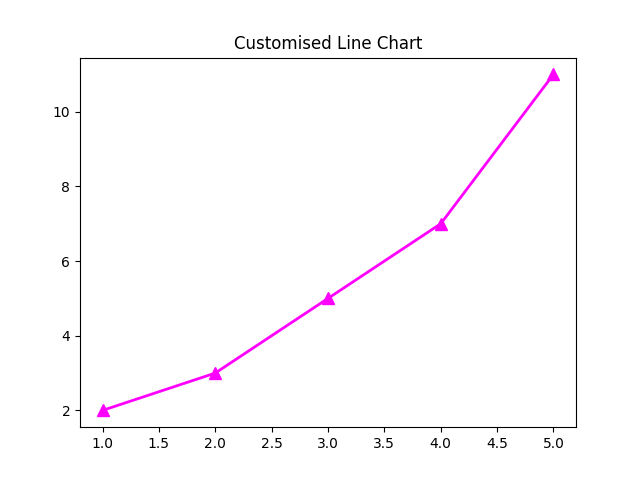
Colour and style customisation
Alternative way of styling the line and markers, with parameters for each format choice.
Styling parameters:
Parameter | Description | Example |
| Line colour |
|
| Style of the line |
|
| Thickness of the line |
|
| Symbol for data points |
|
| Size of the markers |
|
| Marker fill & border colours |
|
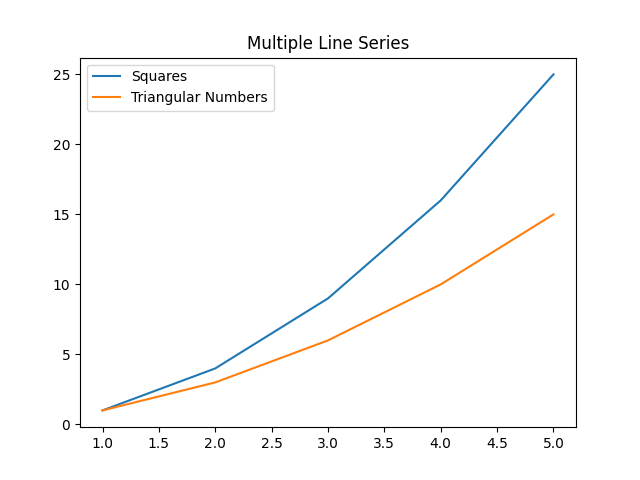
Multiple lines on the same chart
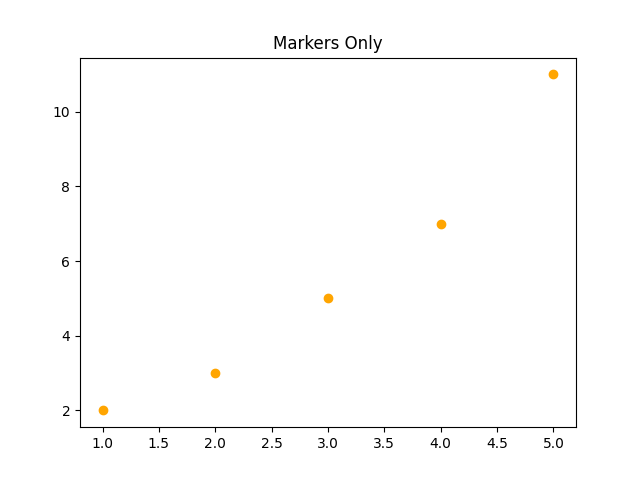
Line with markers only (no connecting line)
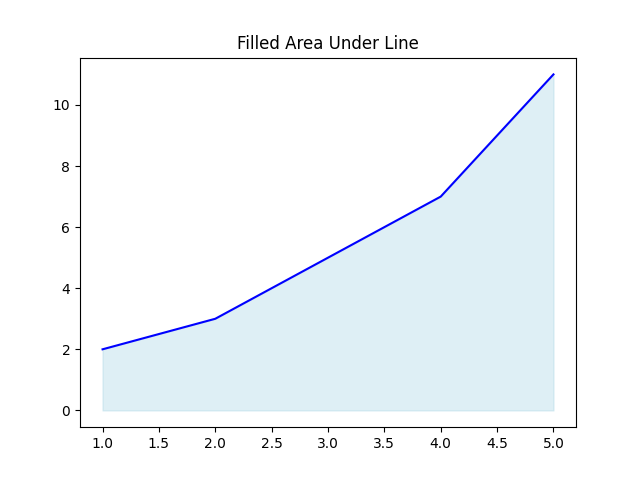
Fill area under a line
Products from our shop
Docker Cheat Sheet - Print at Home Designs

Docker Cheat Sheet Mouse Mat

Docker Cheat Sheet Travel Mug

Docker Cheat Sheet Mug
Vim Cheat Sheet - Print at Home Designs

Vim Cheat Sheet Mouse Mat

Vim Cheat Sheet Travel Mug

Vim Cheat Sheet Mug

SimpleSteps.guide branded Travel Mug

Developer Excuse Javascript - Travel Mug

Developer Excuse Javascript Embroidered T-Shirt - Dark

Developer Excuse Javascript Embroidered T-Shirt - Light

Developer Excuse Javascript Mug - White

Developer Excuse Javascript Mug - Black

SimpleSteps.guide branded stainless steel water bottle

Developer Excuse Javascript Hoodie - Light
