Clustering without a target
Quick ML: machine learning on your iPhone and iPad
3 min read
Published Sep 6 2026
Guide Sections
Guide Comments
Clustering finds natural groups in the data without being told what to look for. There is no target column and no test set. K-means is free; the other three algorithms are Pro.
Setting up
Choose Clustering in the Task control. The target section disappears, and so does the whole train and test split section, because there is nothing to hold out.
The four algorithms are K-Means, DBSCAN (density), Agglomerative (Ward) and Gaussian Mixture. Features can be numeric columns and category columns with up to thirty distinct values. Numeric columns are standardised so that a column measured in thousands does not drown one measured in units, and categories are one-hot encoded, so each value becomes its own 0 or 1 dimension.
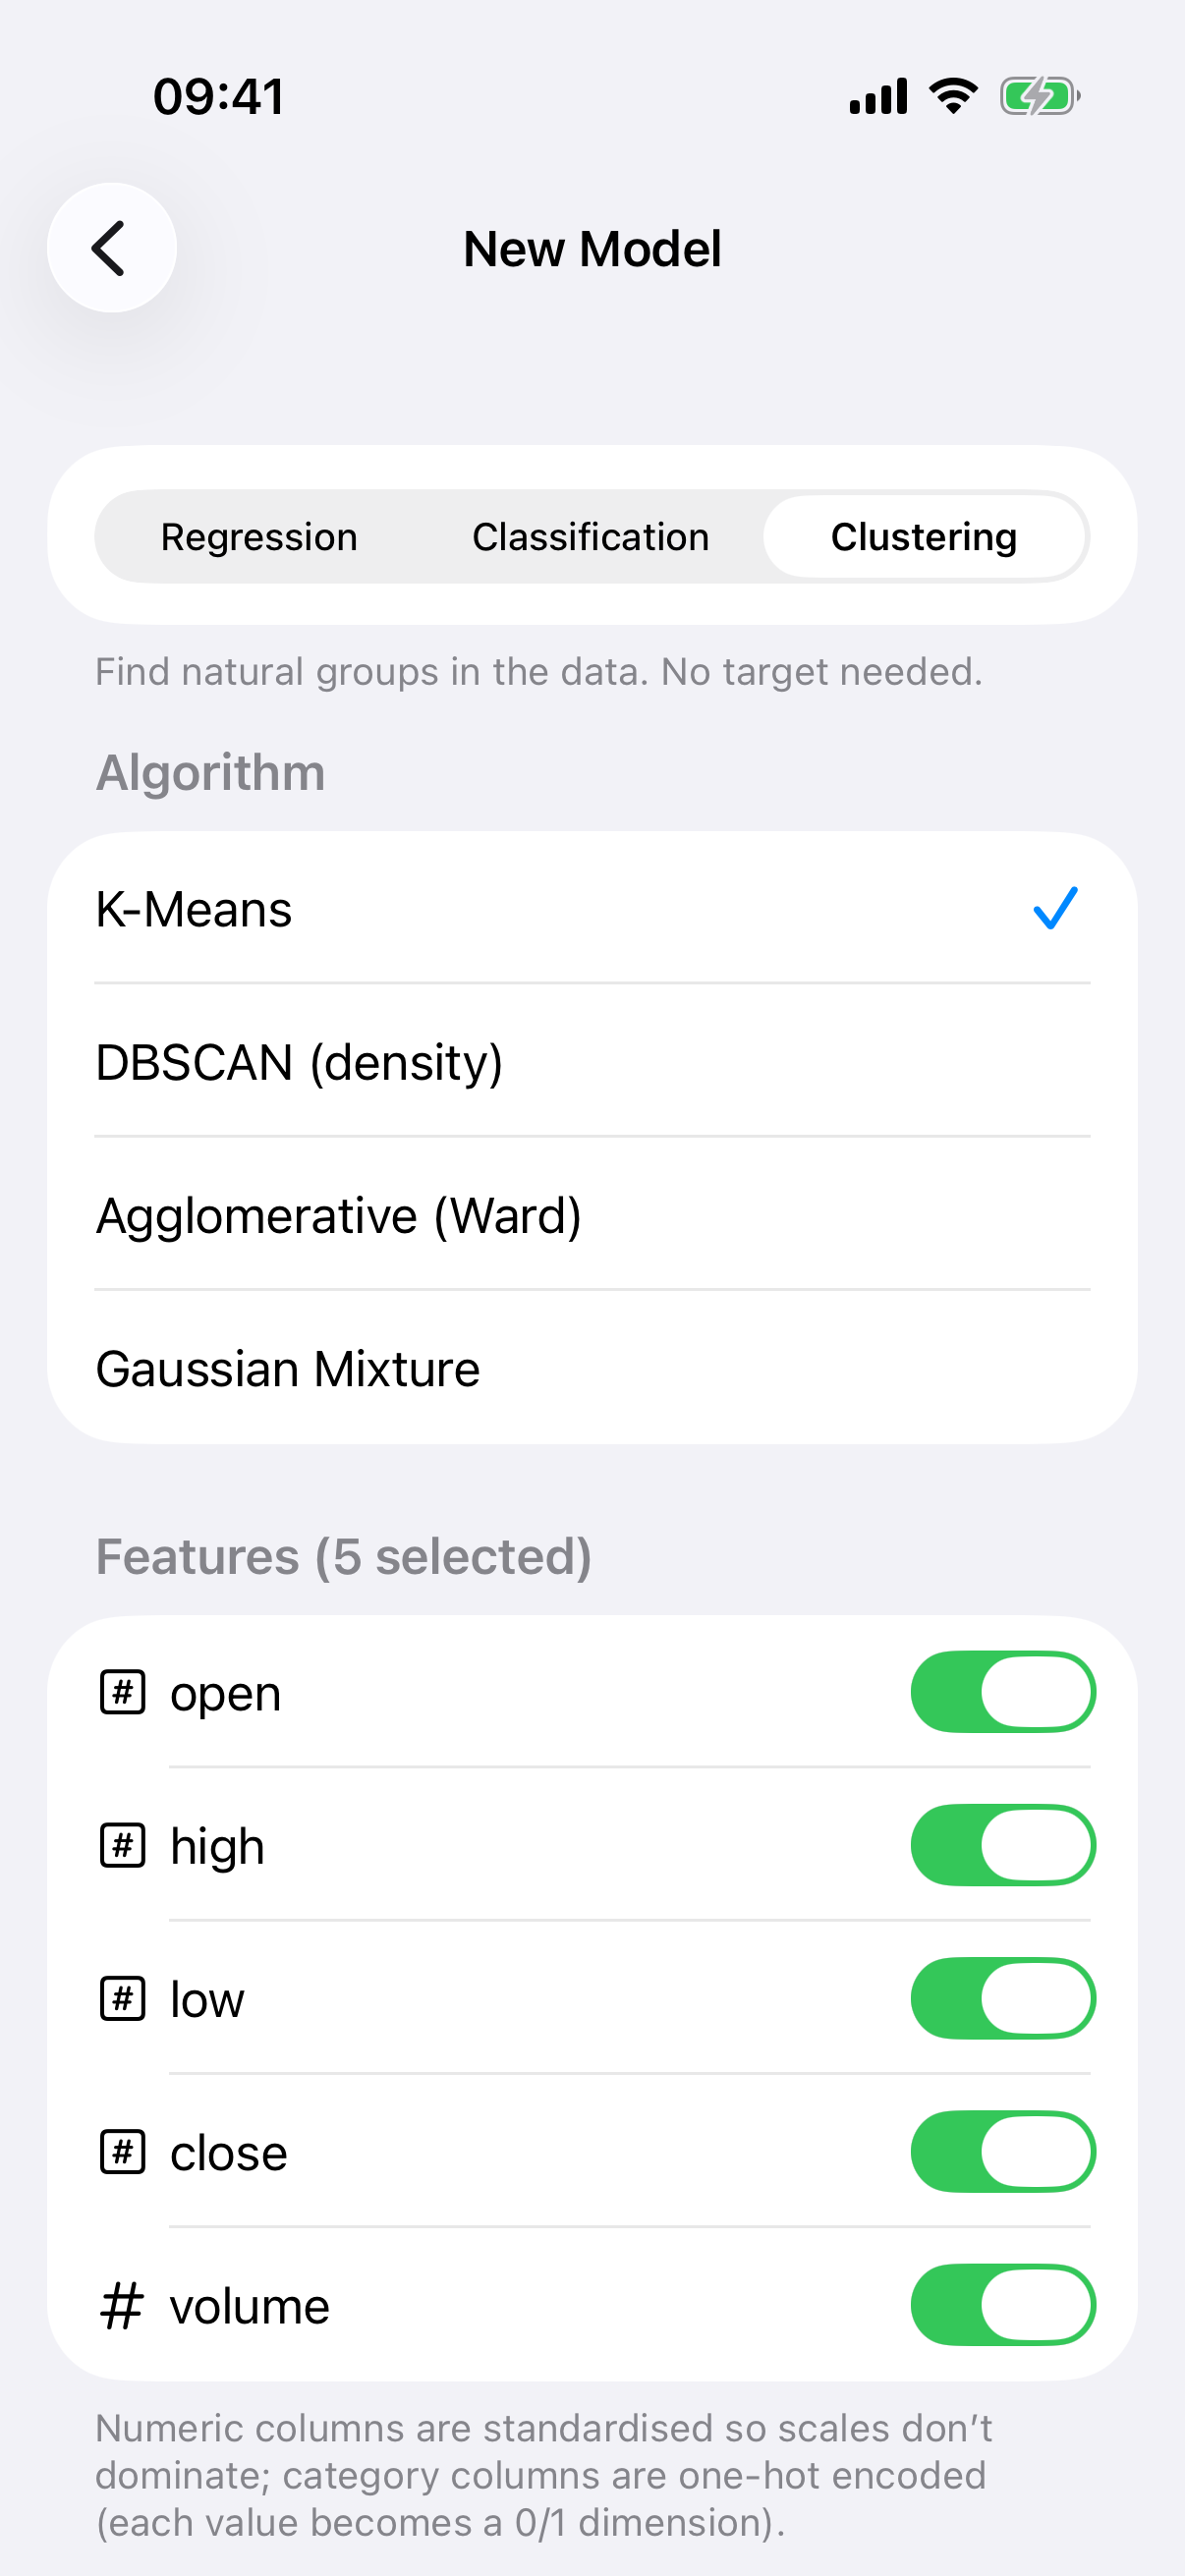
Setting up a clustering model.
How many clusters
A Clusters stepper runs from 2 to 10 and defaults to 3. For k-means there is a button I would encourage you to press before you commit: Suggest k (Elbow & Silhouette).
It runs k-means for each candidate count and draws two charts. The Elbow chart plots inertia against k, and the elbow is where inertia stops dropping sharply. The Silhouette chart draws how well each point sits in its cluster for the best k, with a red line at the average. Wide, tall shapes past the line mean well-separated clusters; values near zero sit between clusters. A verdict line names the best silhouette and its score.
DBSCAN has no cluster count, because it finds its own. Instead it gets a Density section with a neighbourhood radius, which you can leave on auto, and a minimum number of points. Rows that sit in sparse space are labelled as noise rather than forced into a cluster.
Reading the result
The model page opens with a Cluster Map. This is a two-dimensional projection of your data using principal component analysis, coloured by cluster, with a cross marking each cluster's centre. It is the same map every time, because the projection is deterministic.
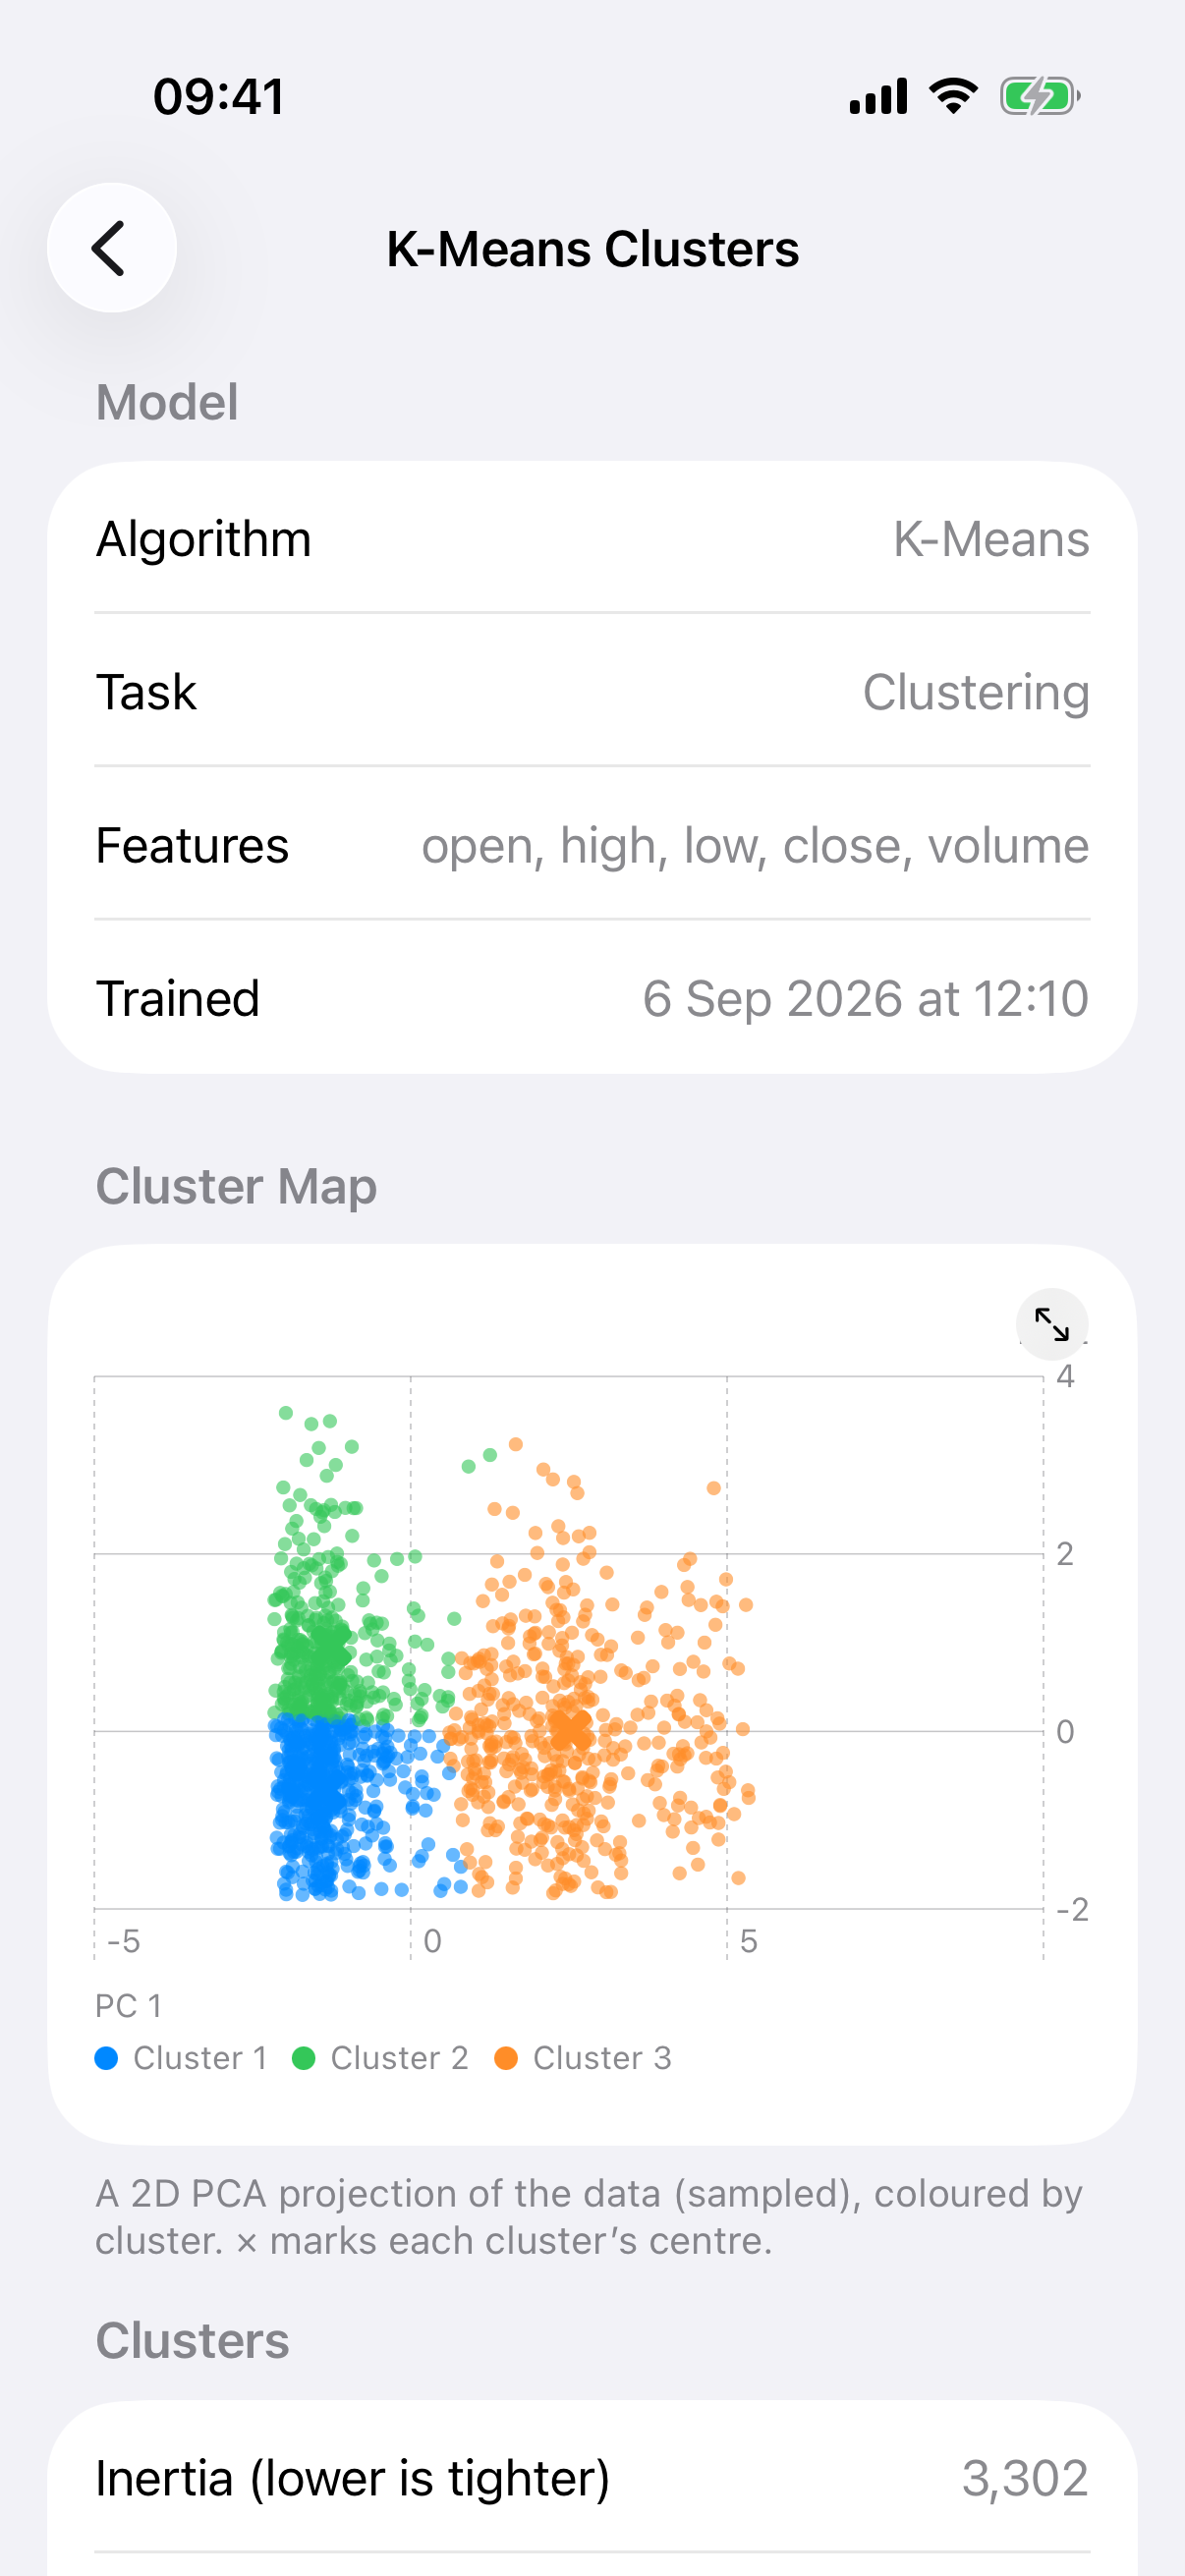
The Cluster Map, a PCA projection coloured by cluster.
Below it, the Clusters section lists each cluster with its row count and the inertia, and then there is one section per cluster showing its centre in original units, one row per feature. For a one-hot category, the row reads as "city = York" with the share of the cluster holding that value, which is the quickest way to put a name to a cluster.
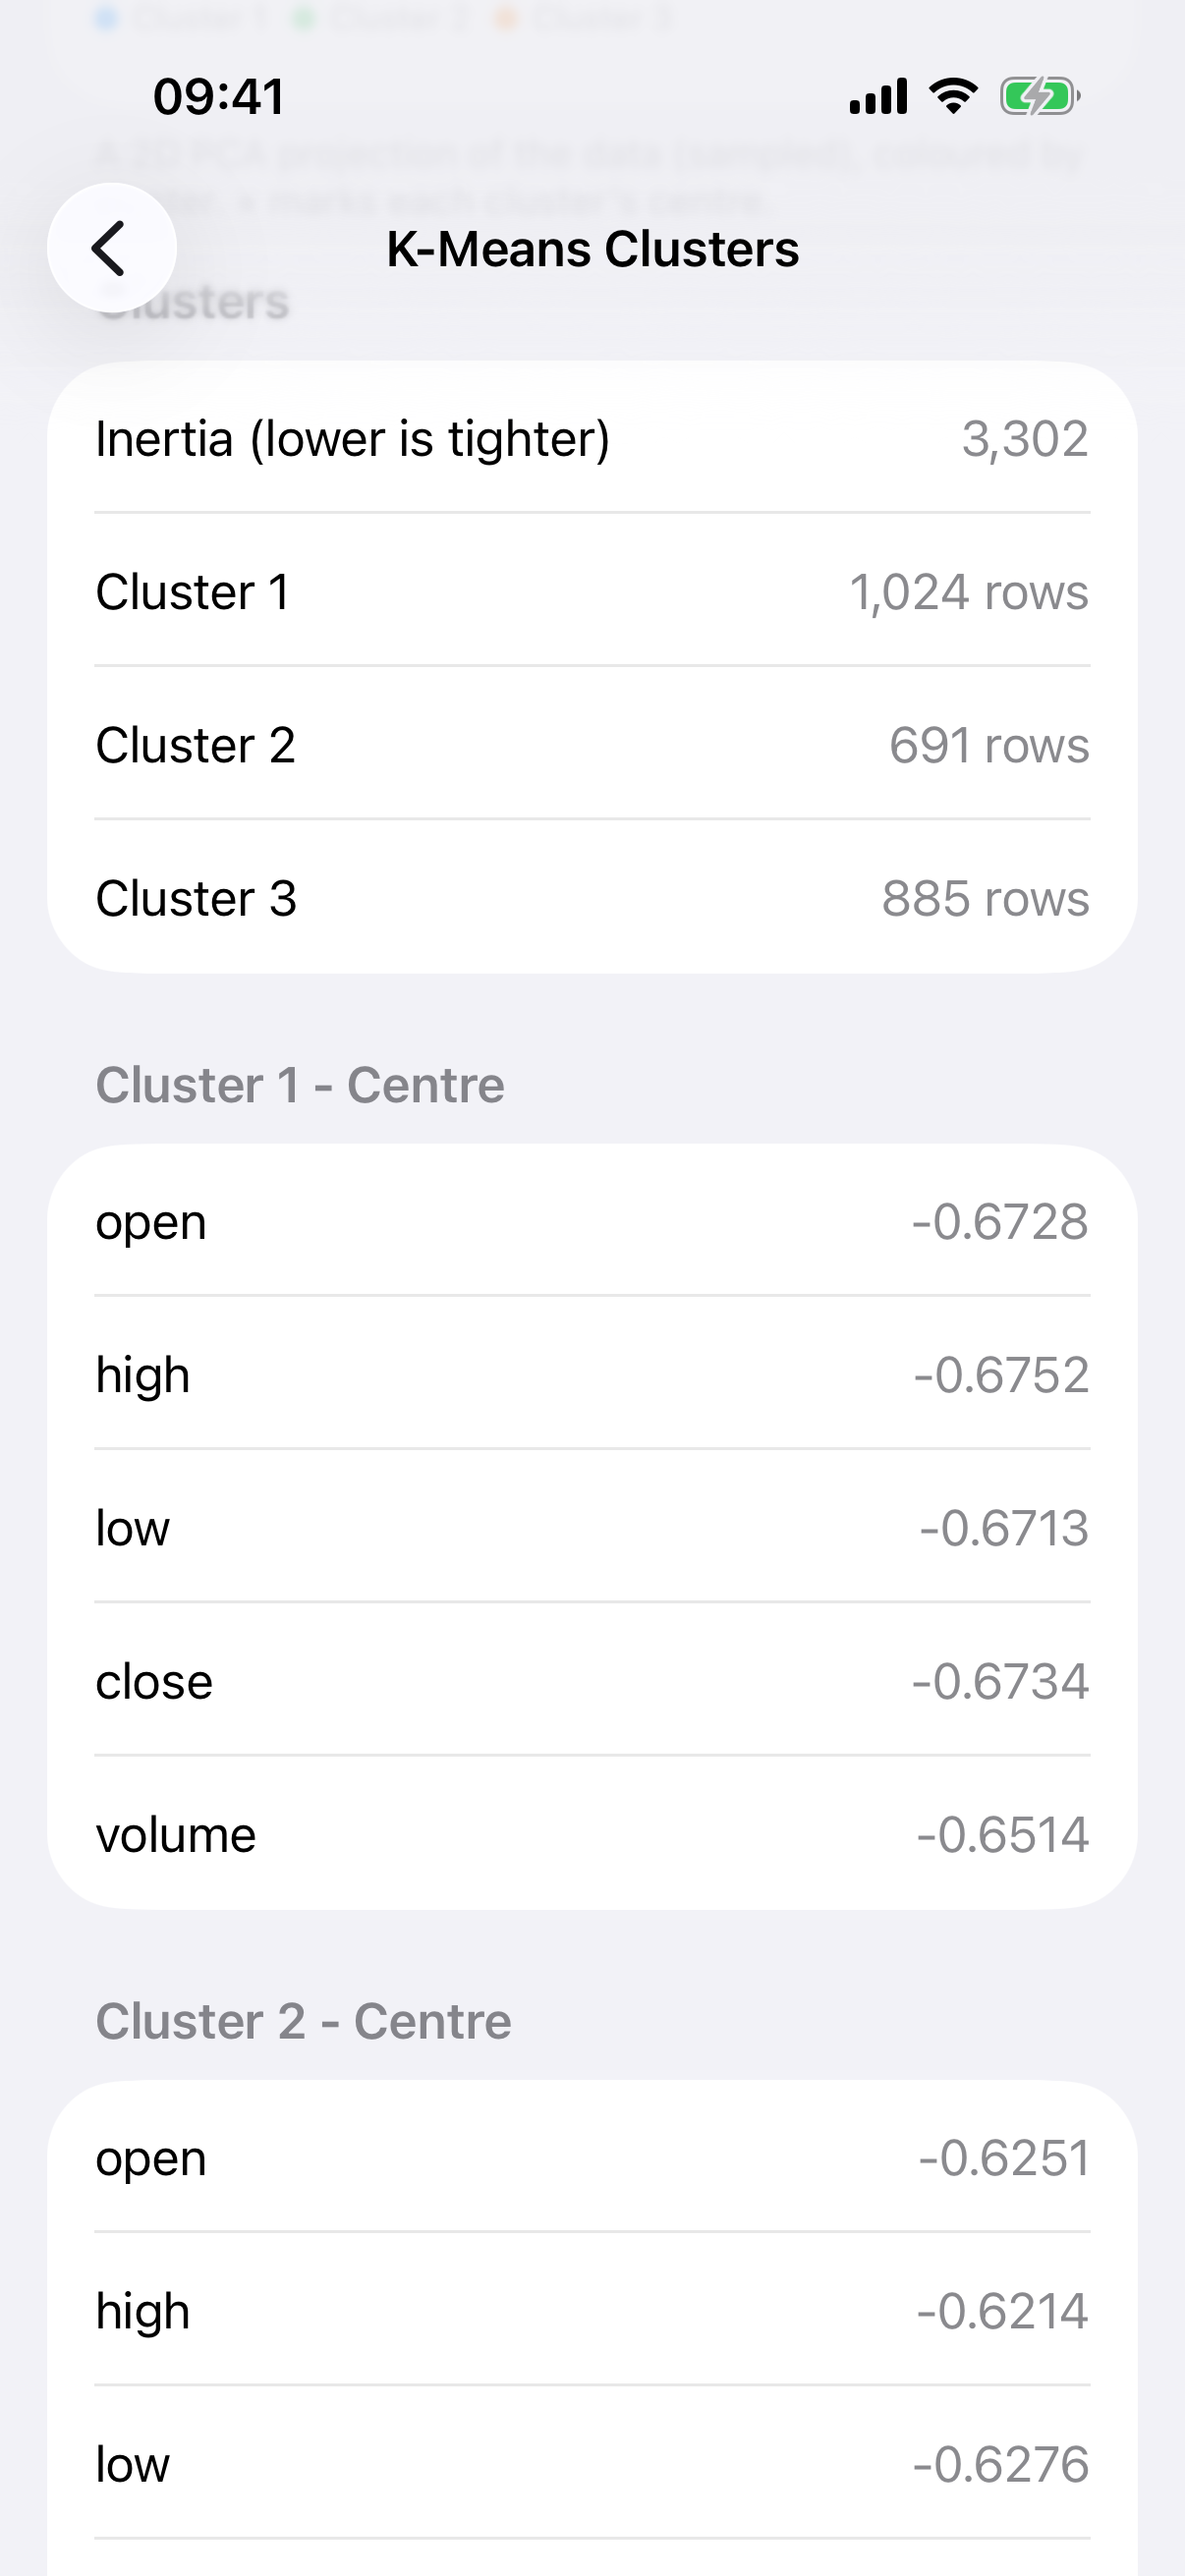
Cluster sizes and centres in original units.
Sampling, said out loud
K-means runs on every row. The other three algorithms are more expensive, so they cluster a sample sized to the device and then assign every remaining row to the nearest cluster they found. When that happens the model page says so in a sentence, with both numbers, rather than leaving you to wonder.
Clustering models appear on the Predict screen too. The form's button reads Find Cluster, and the answer is the cluster a new row belongs to.