Columns, types and calculated columns
Quick ML: machine learning on your iPhone and iPad
5 min read
Published Sep 6 2026
Guide Sections
Guide Comments
Tap any column in the Columns list on the Data screen, or tap a column header in the table, and you get the column explorer. It is where you find out what a column really contains, fix its type, and make new columns out of it.
Statistics that are not sampled
The Statistics section shows type, values and missing count for every column. Numeric columns add minimum, maximum, mean, standard deviation, median, both quartiles, skewness, kurtosis and the outlier count. Text and category columns add the distinct count and the most frequent value.
None of this is sampled. The figures come from streaming scans of the whole column, however many rows there are, and the maths matches what pandas reports: a sample standard deviation, bias-corrected skew and excess kurtosis. If you are checking the app's numbers against a notebook, they should agree to the last decimal.
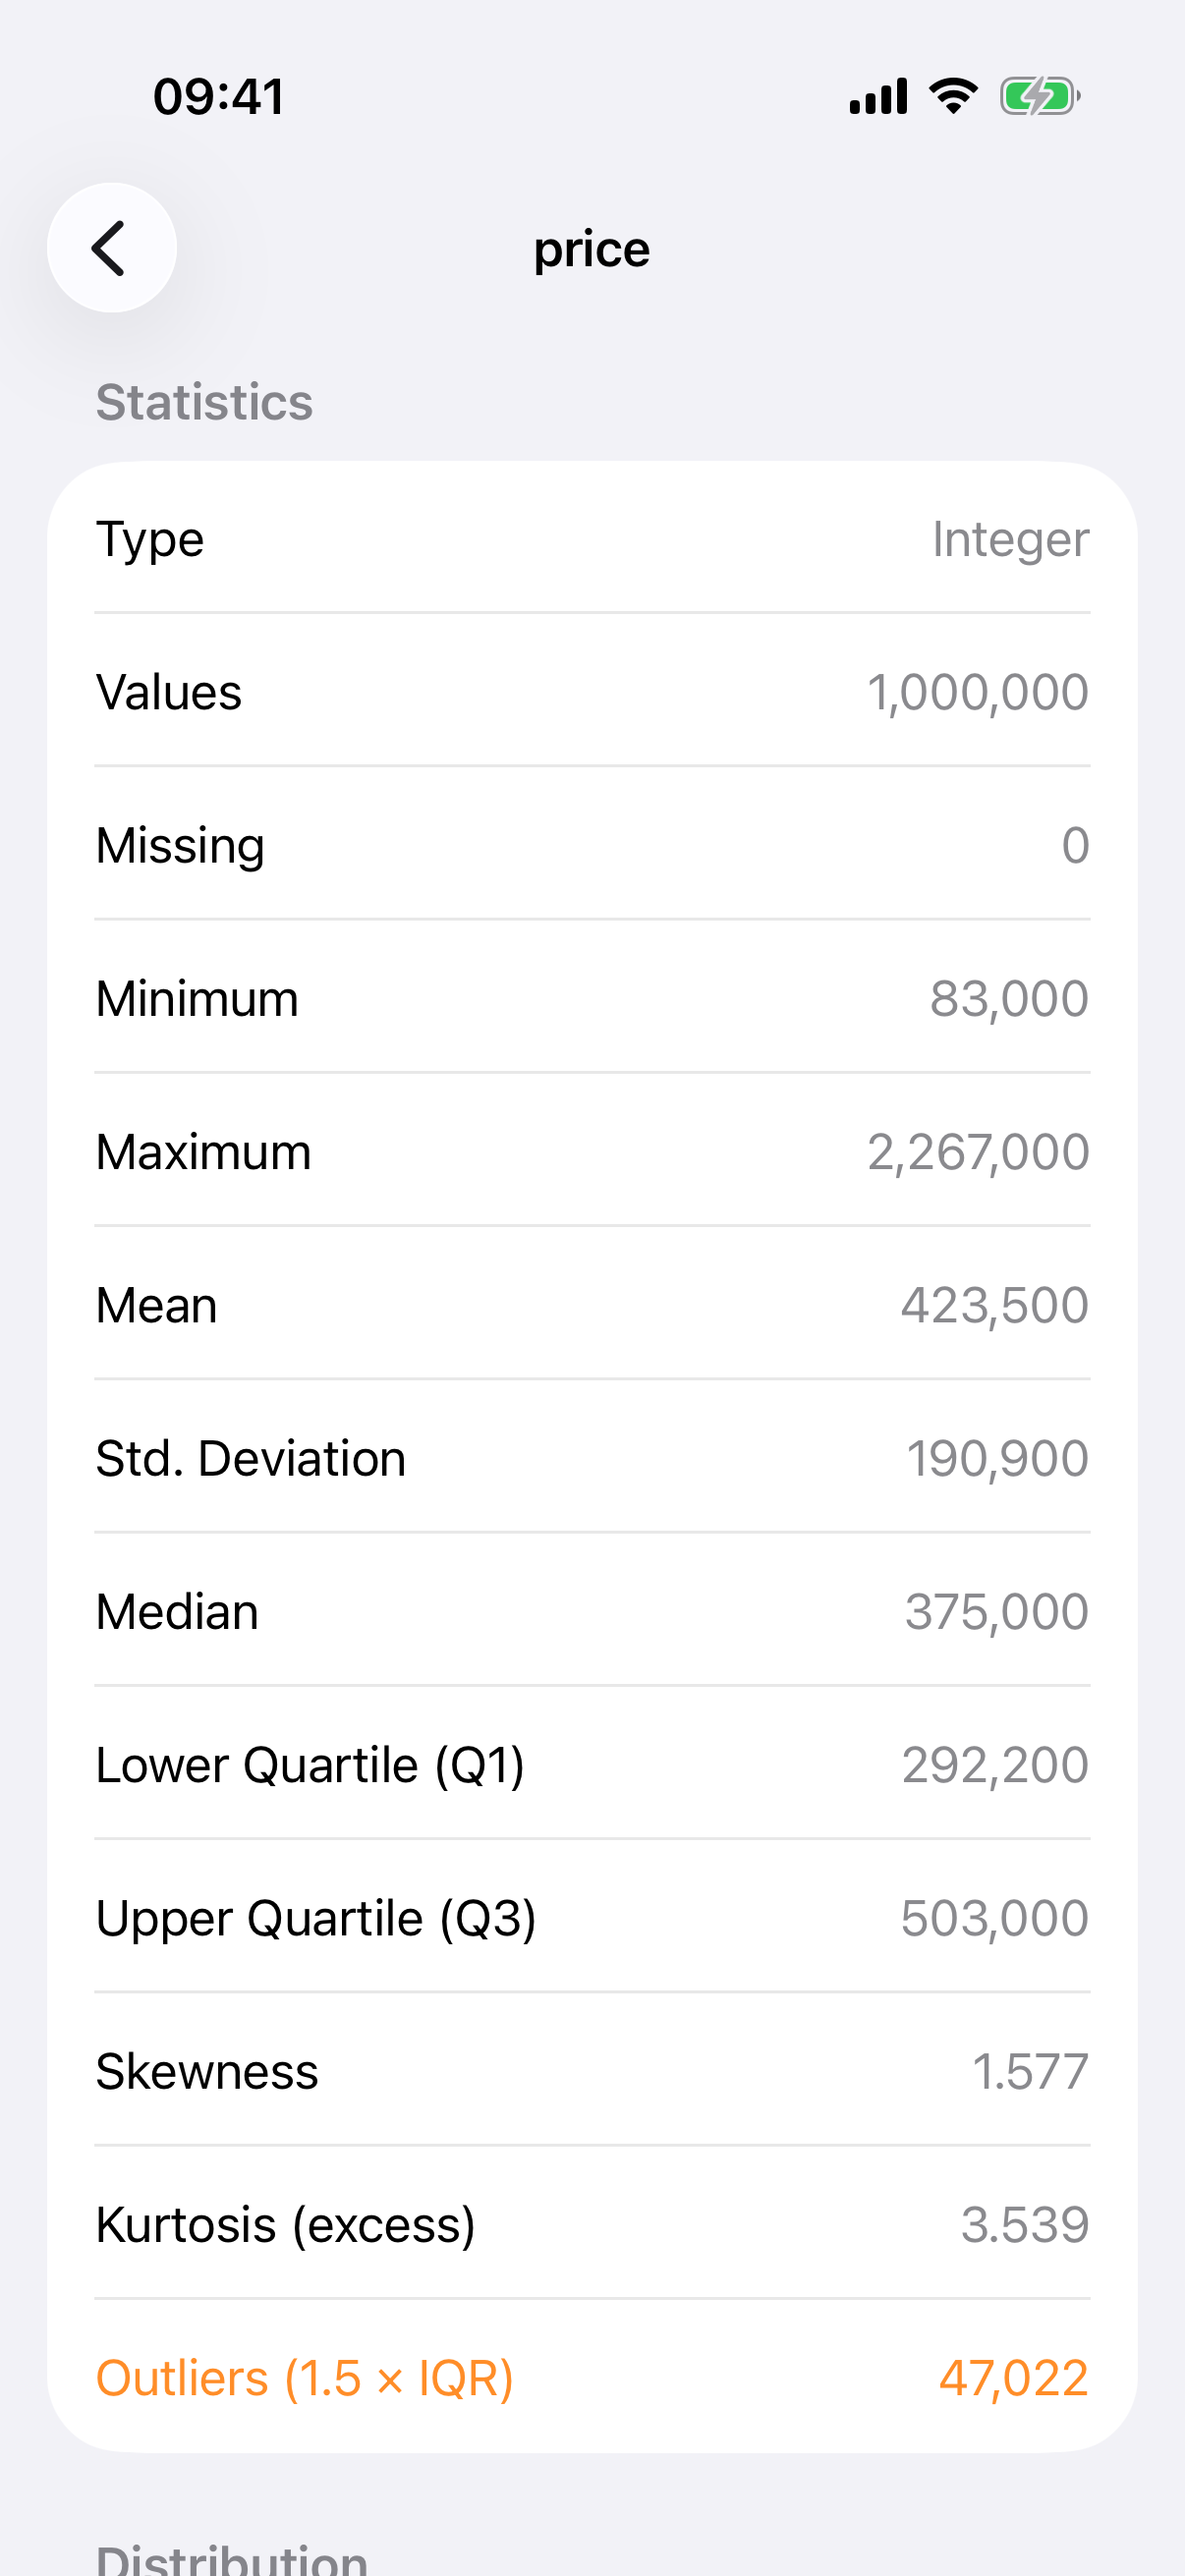
Statistics for a numeric column, computed over every row.
Charts
Numeric columns get a Distribution chart with a choice of Histogram, Box or Violin. The histogram has a bin slider that starts at the Freedman-Diaconis suggestion, an optional density curve, and guide lines for the quartiles, mean, mode and standard deviations. Category and text columns get a Top Values bar chart of the twelve commonest values as counts or percentages, and a link to All Distinct Values, where you can merge variant spellings into one. Date columns get rows per year, with a drill-down into months.
Every chart expands to full screen where you can pinch to zoom, save it to Photos or share it.
The six types
Quick ML infers one of six types for each column: Integer, Decimal, Boolean, Date, Category and Text. It usually guesses right, and when it does not, the fix is at the bottom of the explorer in the Column section. The Data Type picker shows the inferred type as Auto and lets you override it.
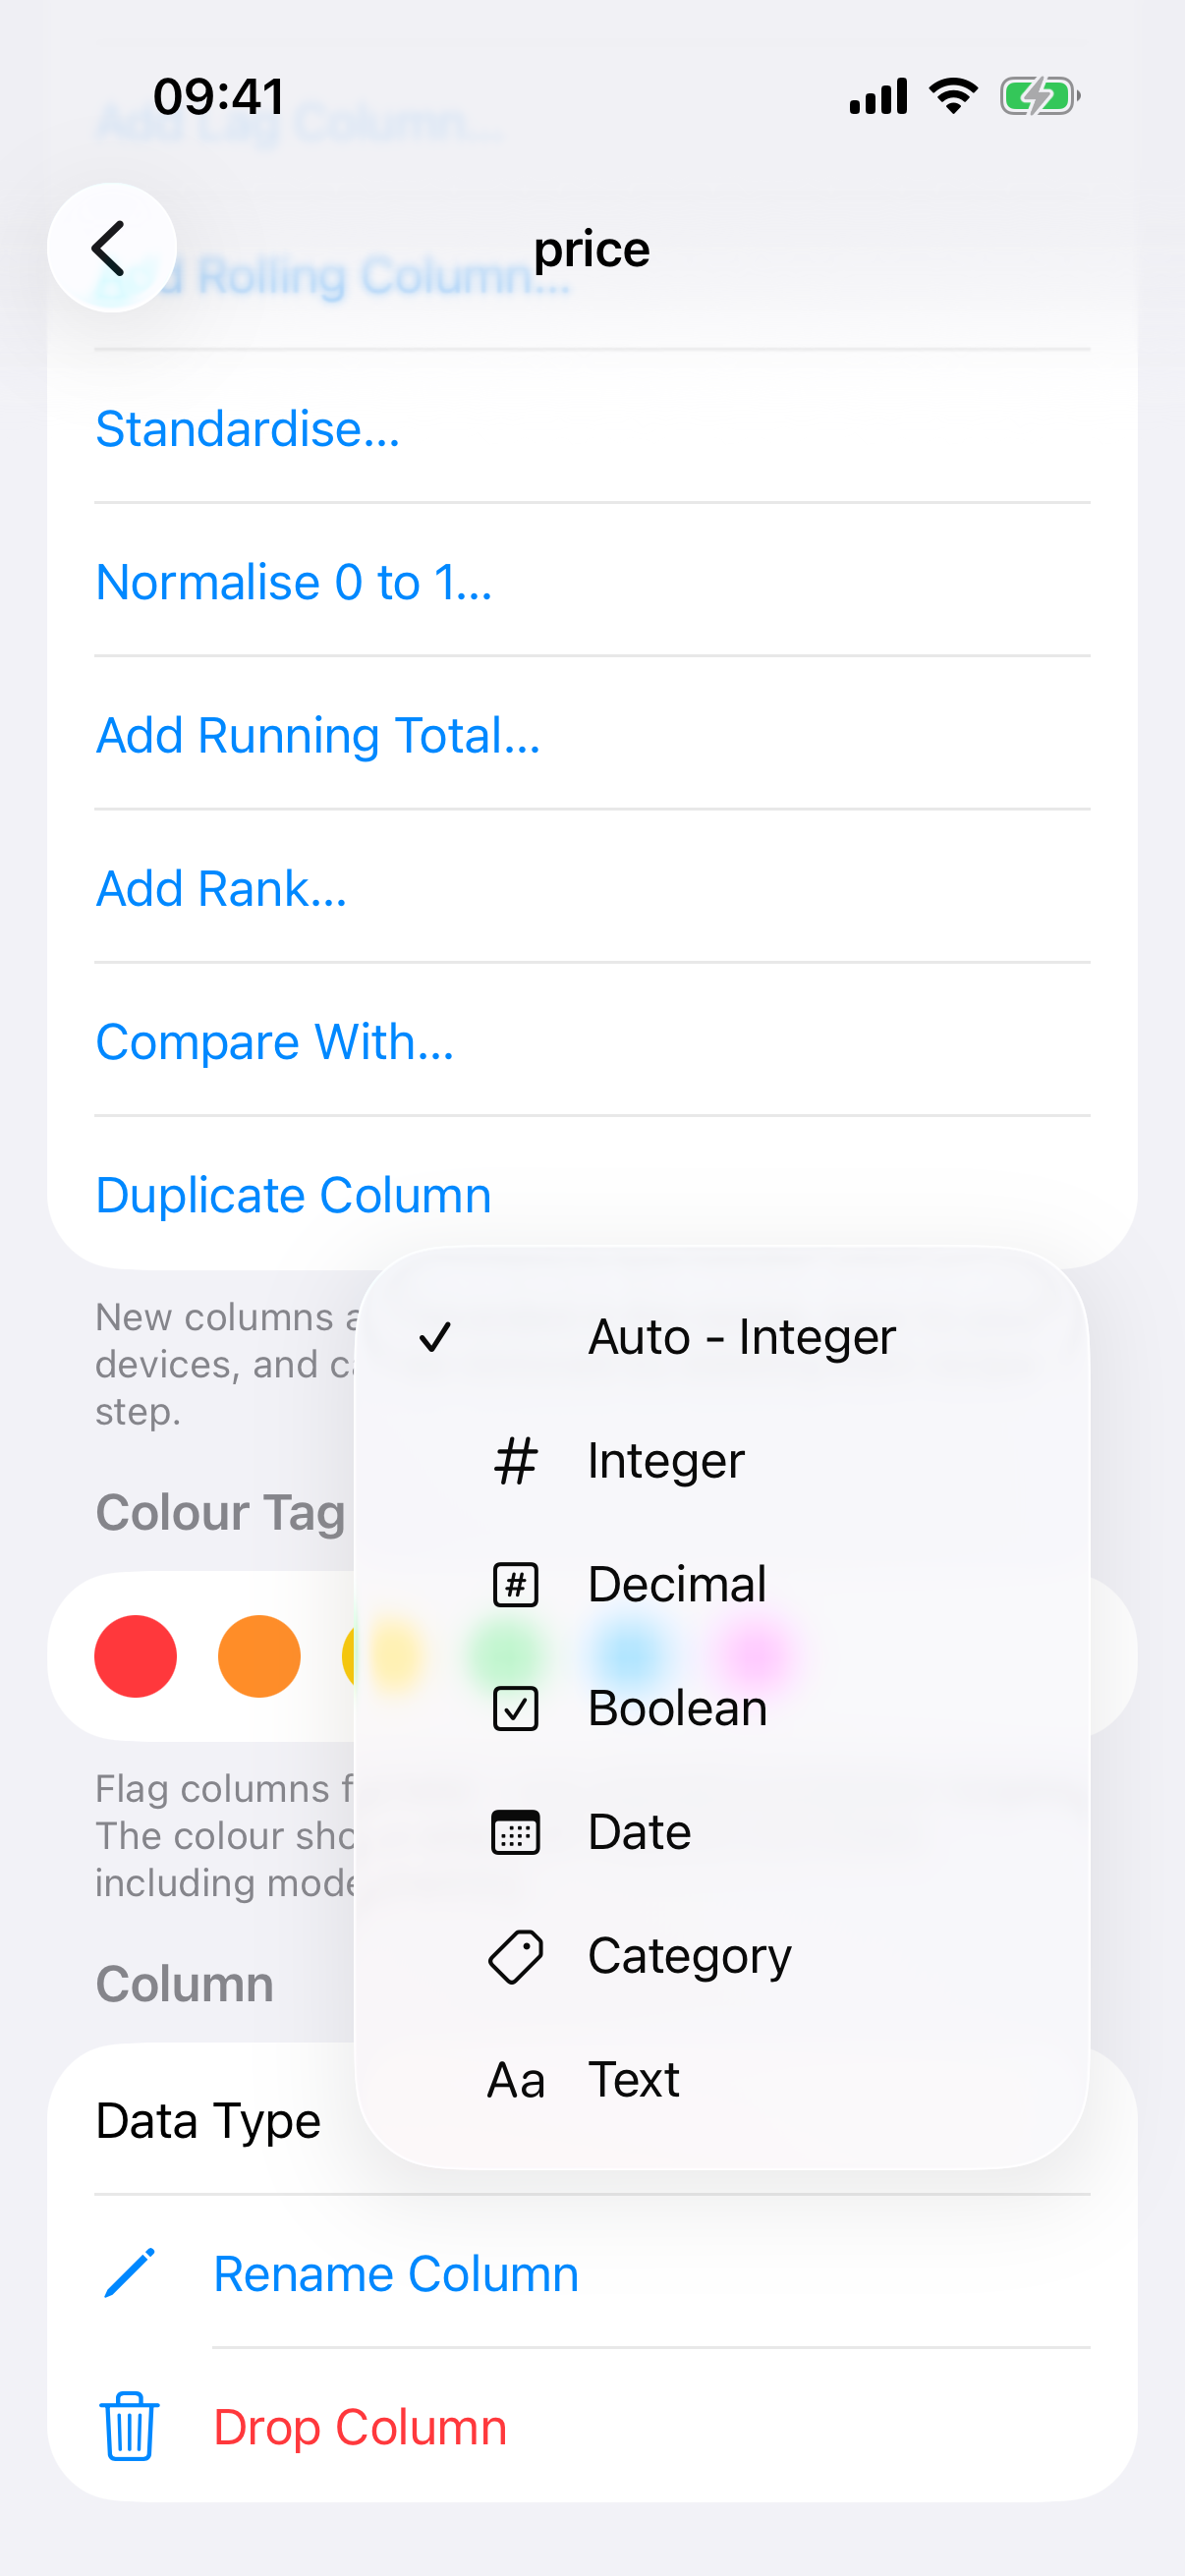
The Data Type picker with the six types.
An override is metadata. The stored data is not rewritten, but everything downstream reads the new type immediately: retype a text column as Integer and the Top Values chart becomes a histogram on the spot, and the calculated column menu changes to match.
The same section holds Category Order, where you can mark a category as ordinal and drag its levels into order (education levels, size bands), Rename Column, Drop Column and a Colour Tag. Tags are a small thing I use constantly: flag the columns you think might make good targets, and the colour follows them into every column list, including the training screen.
Calculated columns
The Derived Columns section is the app's spreadsheet formula bar, except that every column it makes is a recipe step: synced, replayable and removable. What it offers depends on the column's type.
- Date columns give year, month, month name, season, day, day of week and week of year with one tap, plus hour, AM/PM, date only and time only when the values carry a time. Add Date Difference measures to another column or to a fixed date (an age from a date of birth, days left to a deadline), and Shift Dates moves every date by an amount you type.
- Text columns give a sentiment score from Apple's on-device model, a detected language, eleven text measurements from word count to Flesch readability, Extract From JSON for columns holding JSON blobs, and an AI Column that answers a plain English question about each row's text. AI columns run on the device and read up to 500 rows per sitting on the free version, 20,000 on Pro.
- Text and category columns can be split on a separator into several columns, joined with other columns in an order you choose, or mined for a number with Extract Number.
- Numeric columns give binning into groups, a ratio against another column, sum, mean, minimum, maximum, difference and product across columns, arithmetic with a constant, twelve functions from square root to log to rounding, lag and rolling windows, standardise and normalise, and running total, rank, percentile and row number.
- Any column can be compared with another column or a value to give a true/false column or one with your own two labels, and any column can be duplicated.
Empty, never zero
Every calculated column leaves a row empty rather than inventing an answer when the answer is not known: a value that will not read as a number, a date that will not parse, one side of a comparison missing, the square root of a negative. Each sheet previews the real function over the first few values so you see the blanks before you add the column.
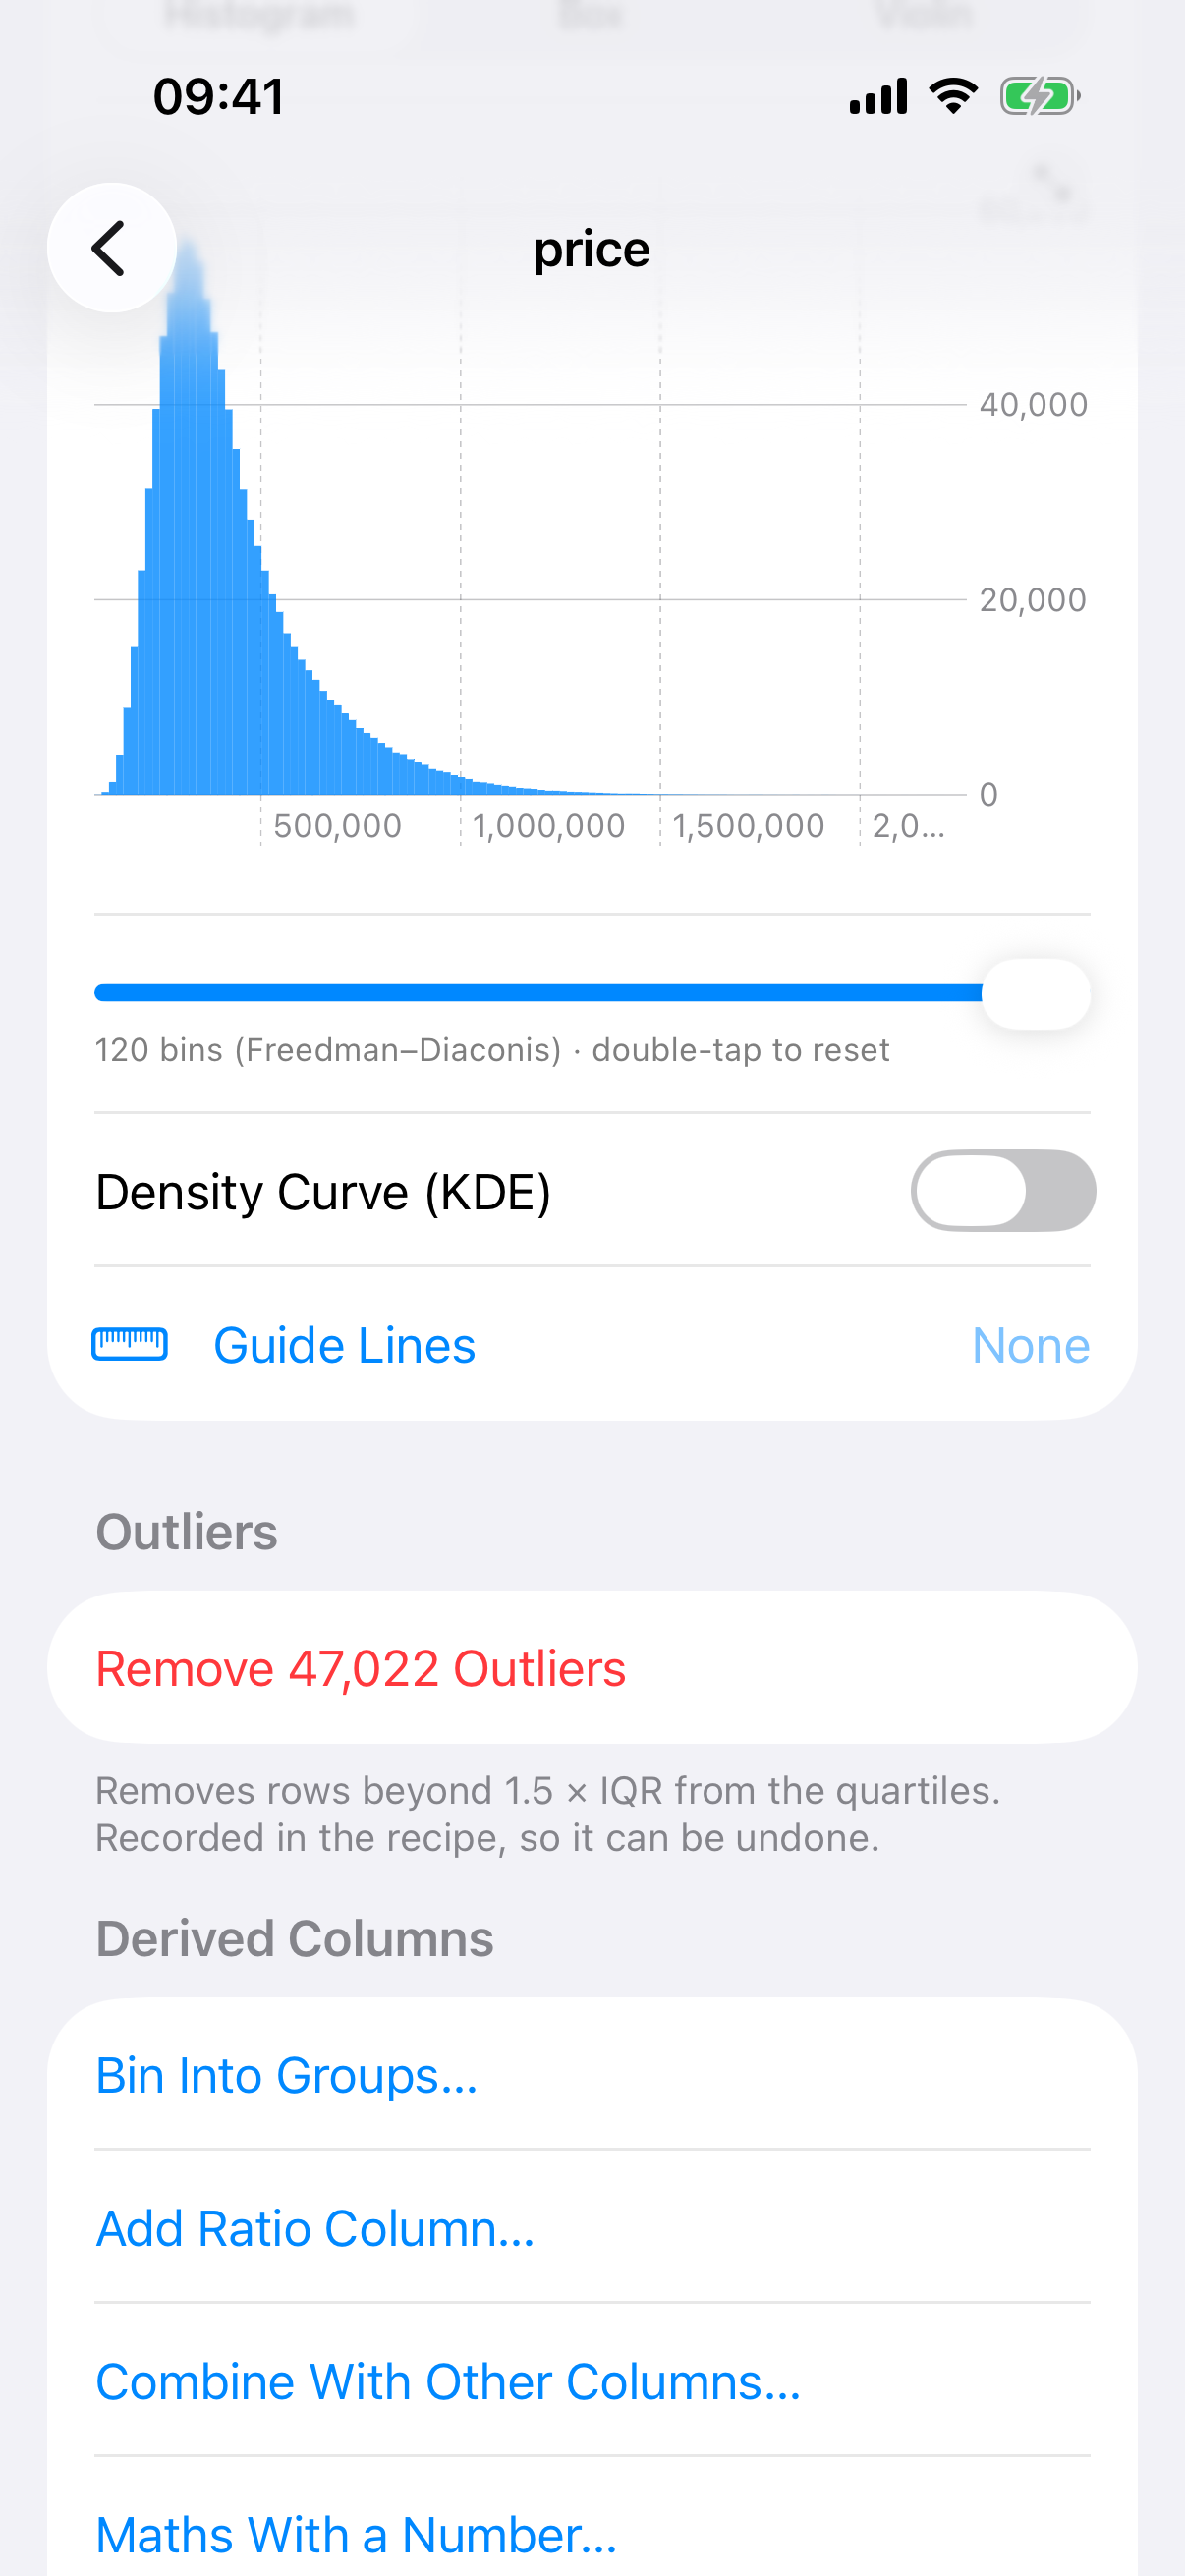
The histogram, the outlier count and the start of the calculated column list.
Two design choices are worth a sentence each. Date Difference will not measure to "today", because a recipe has to give the same answer on every device and every replay, so you pick a fixed date. And Standardise stores the mean and standard deviation inside the step, so a replay after new rows are appended scales by the same two numbers rather than drifting.
Analysis across columns
Back on the Data screen, the Analysis section offers three screens, all free:
- Correlation Matrix, with Pearson or Spearman, a Columns menu to pick a subset, and a Strongest Pairs list that opens a scatter plot when tapped. The footer tells you how many complete rows it used and whether it sampled.
- Pair Plots, which draw a scatter, a set of violins or grouped bars depending on the two columns you pick.
- Statistical Tests, with nine tests from chi-square and ANOVA to Mann-Whitney U and a Bayes' theorem calculator, each giving a p-value and a plain English verdict.
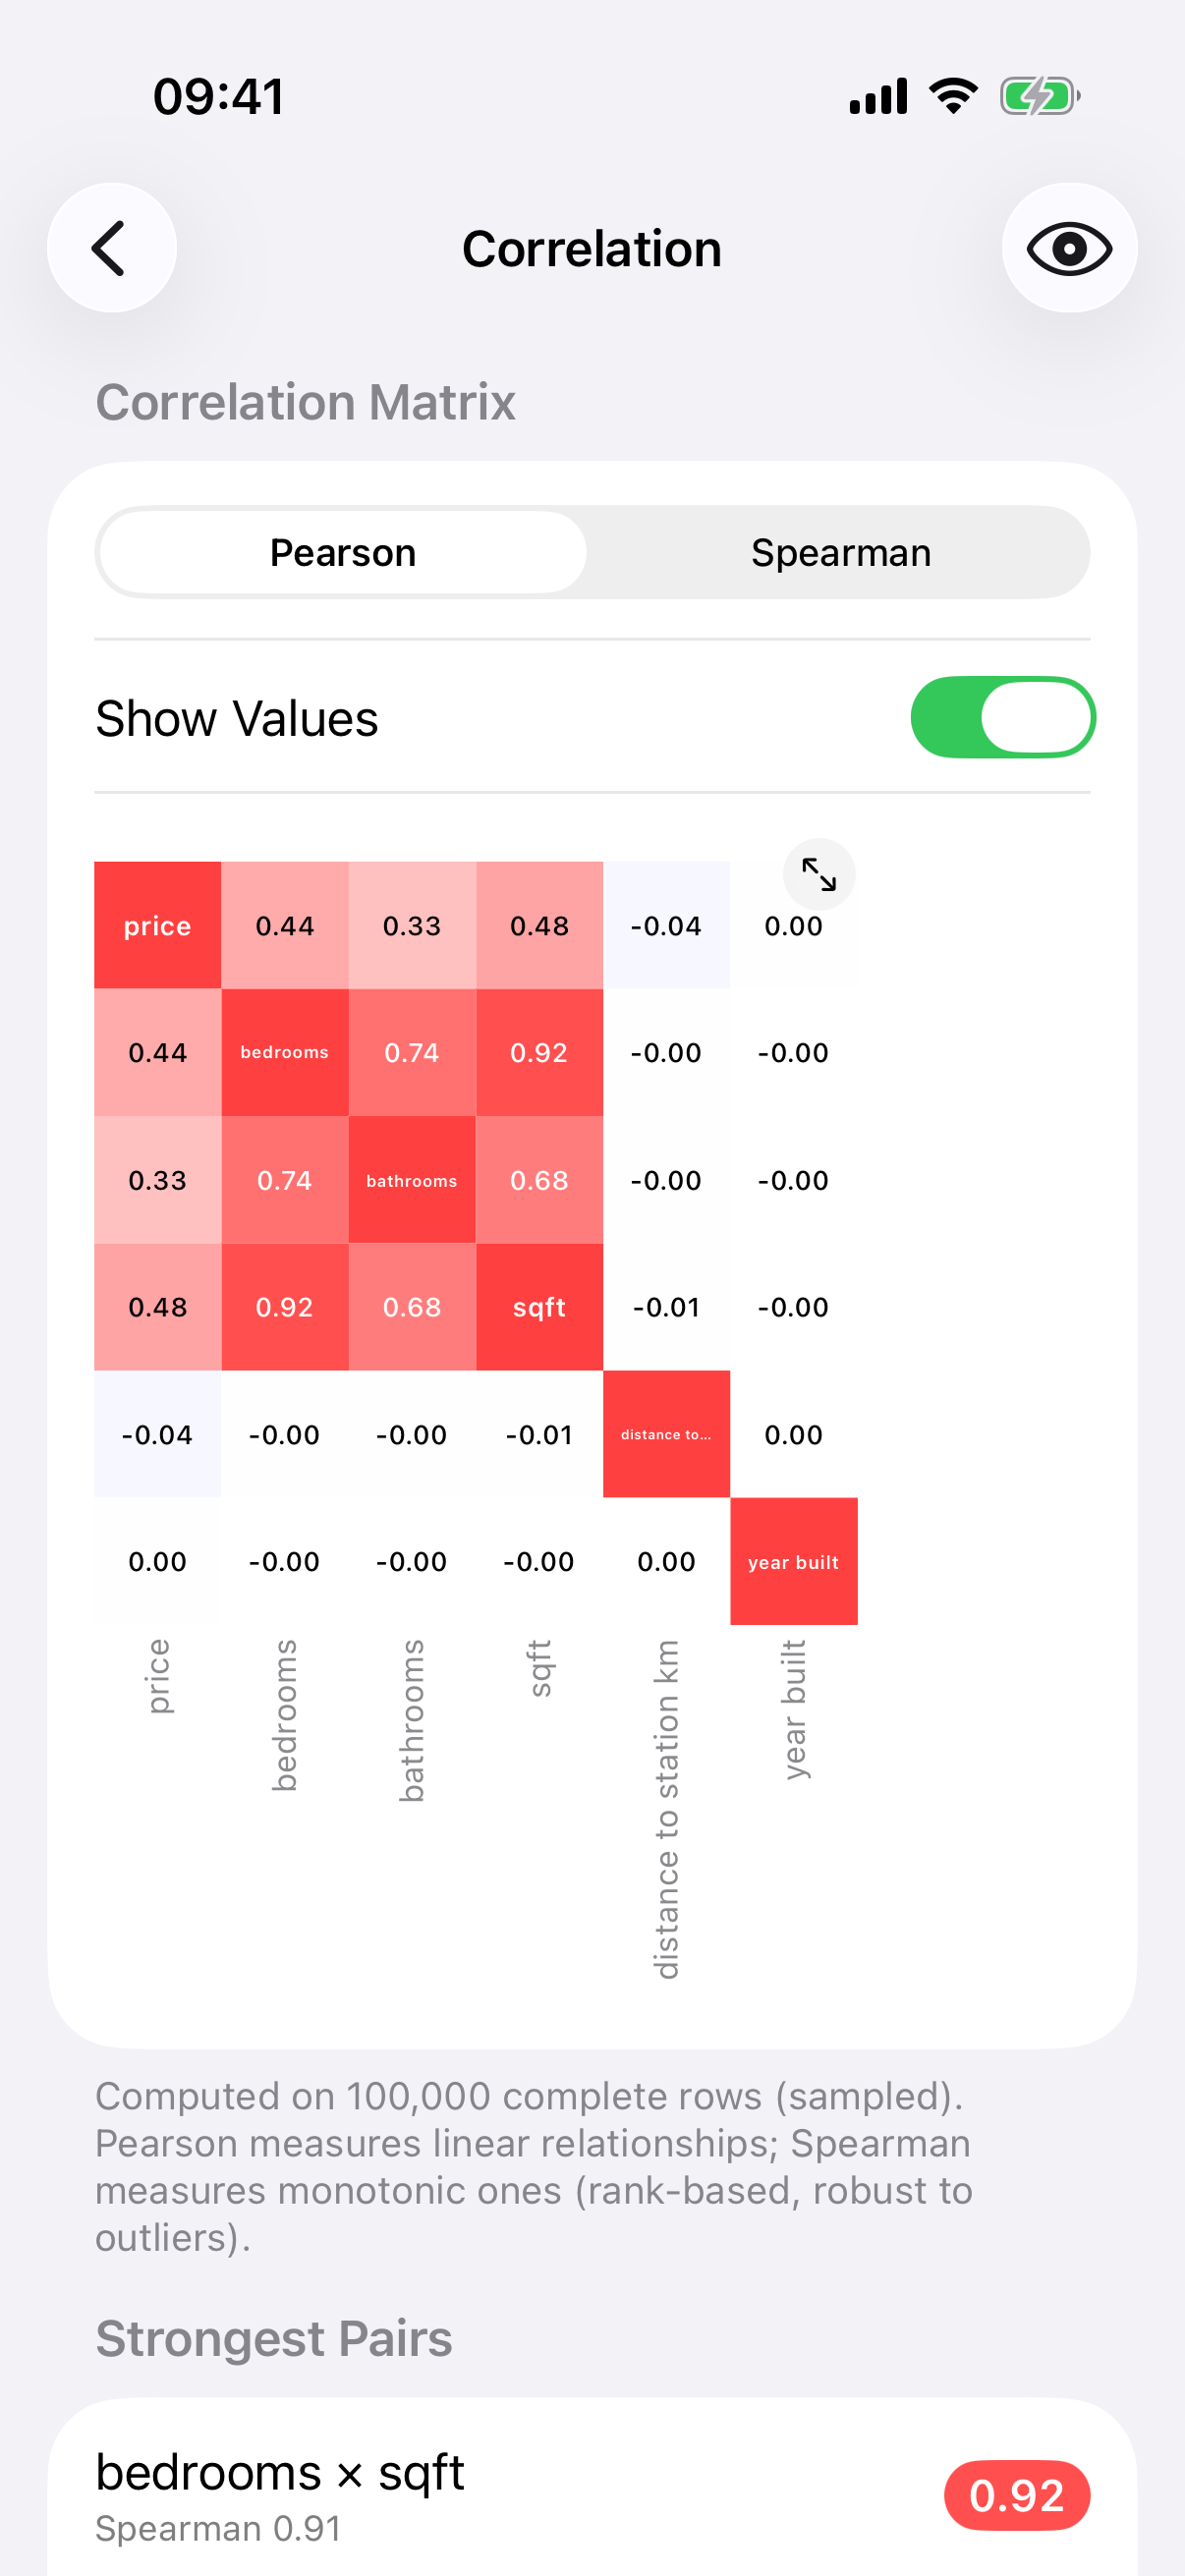
The correlation matrix with its strongest pairs.
Anonymising data
Anonymise Data in the cleaning menu scans your columns for names, emails, phone numbers, postcodes and addresses, and shows you what it found. That scan is free. Applying the replacements is a Pro feature, with thirteen strategies including fake names, scrambled phone numbers that keep their format, dates reduced to month or year, number bands and jitter. Replacements are consistent, so the same original always becomes the same fake and your joins and group-bys keep working. A separate Make Permanent step rewrites the stored files themselves, after which there is no way back to the real data, and the app says so twice before it does it.