Predicting new values
Quick ML: machine learning on your iPhone and iPad
3 min read
Published Sep 6 2026
Guide Sections
Guide Comments
A model that cannot answer a question is a very expensive chart. The Predict stage on the project screen is where the models earn their keep, and every part of it is free, including running a whole file through a model and scoring it.
Choosing a model
Tap Predict. Until you have trained something the row is locked and says so. Once you have, a Choose a Model list shows every model in the project, newest first, with what it predicts and its headline metric.
The generated form
Tap a model and you get a form built from its features. There are three kinds of field:
- Numeric features get a text field and a slider running from the column's smallest value to its largest, with those two values printed underneath. Integer columns snap the slider to whole numbers.
- Category features get a picker of the thirty commonest values, with an Other option that turns into a text field for anything rarer.
- Everything else gets a plain text field.
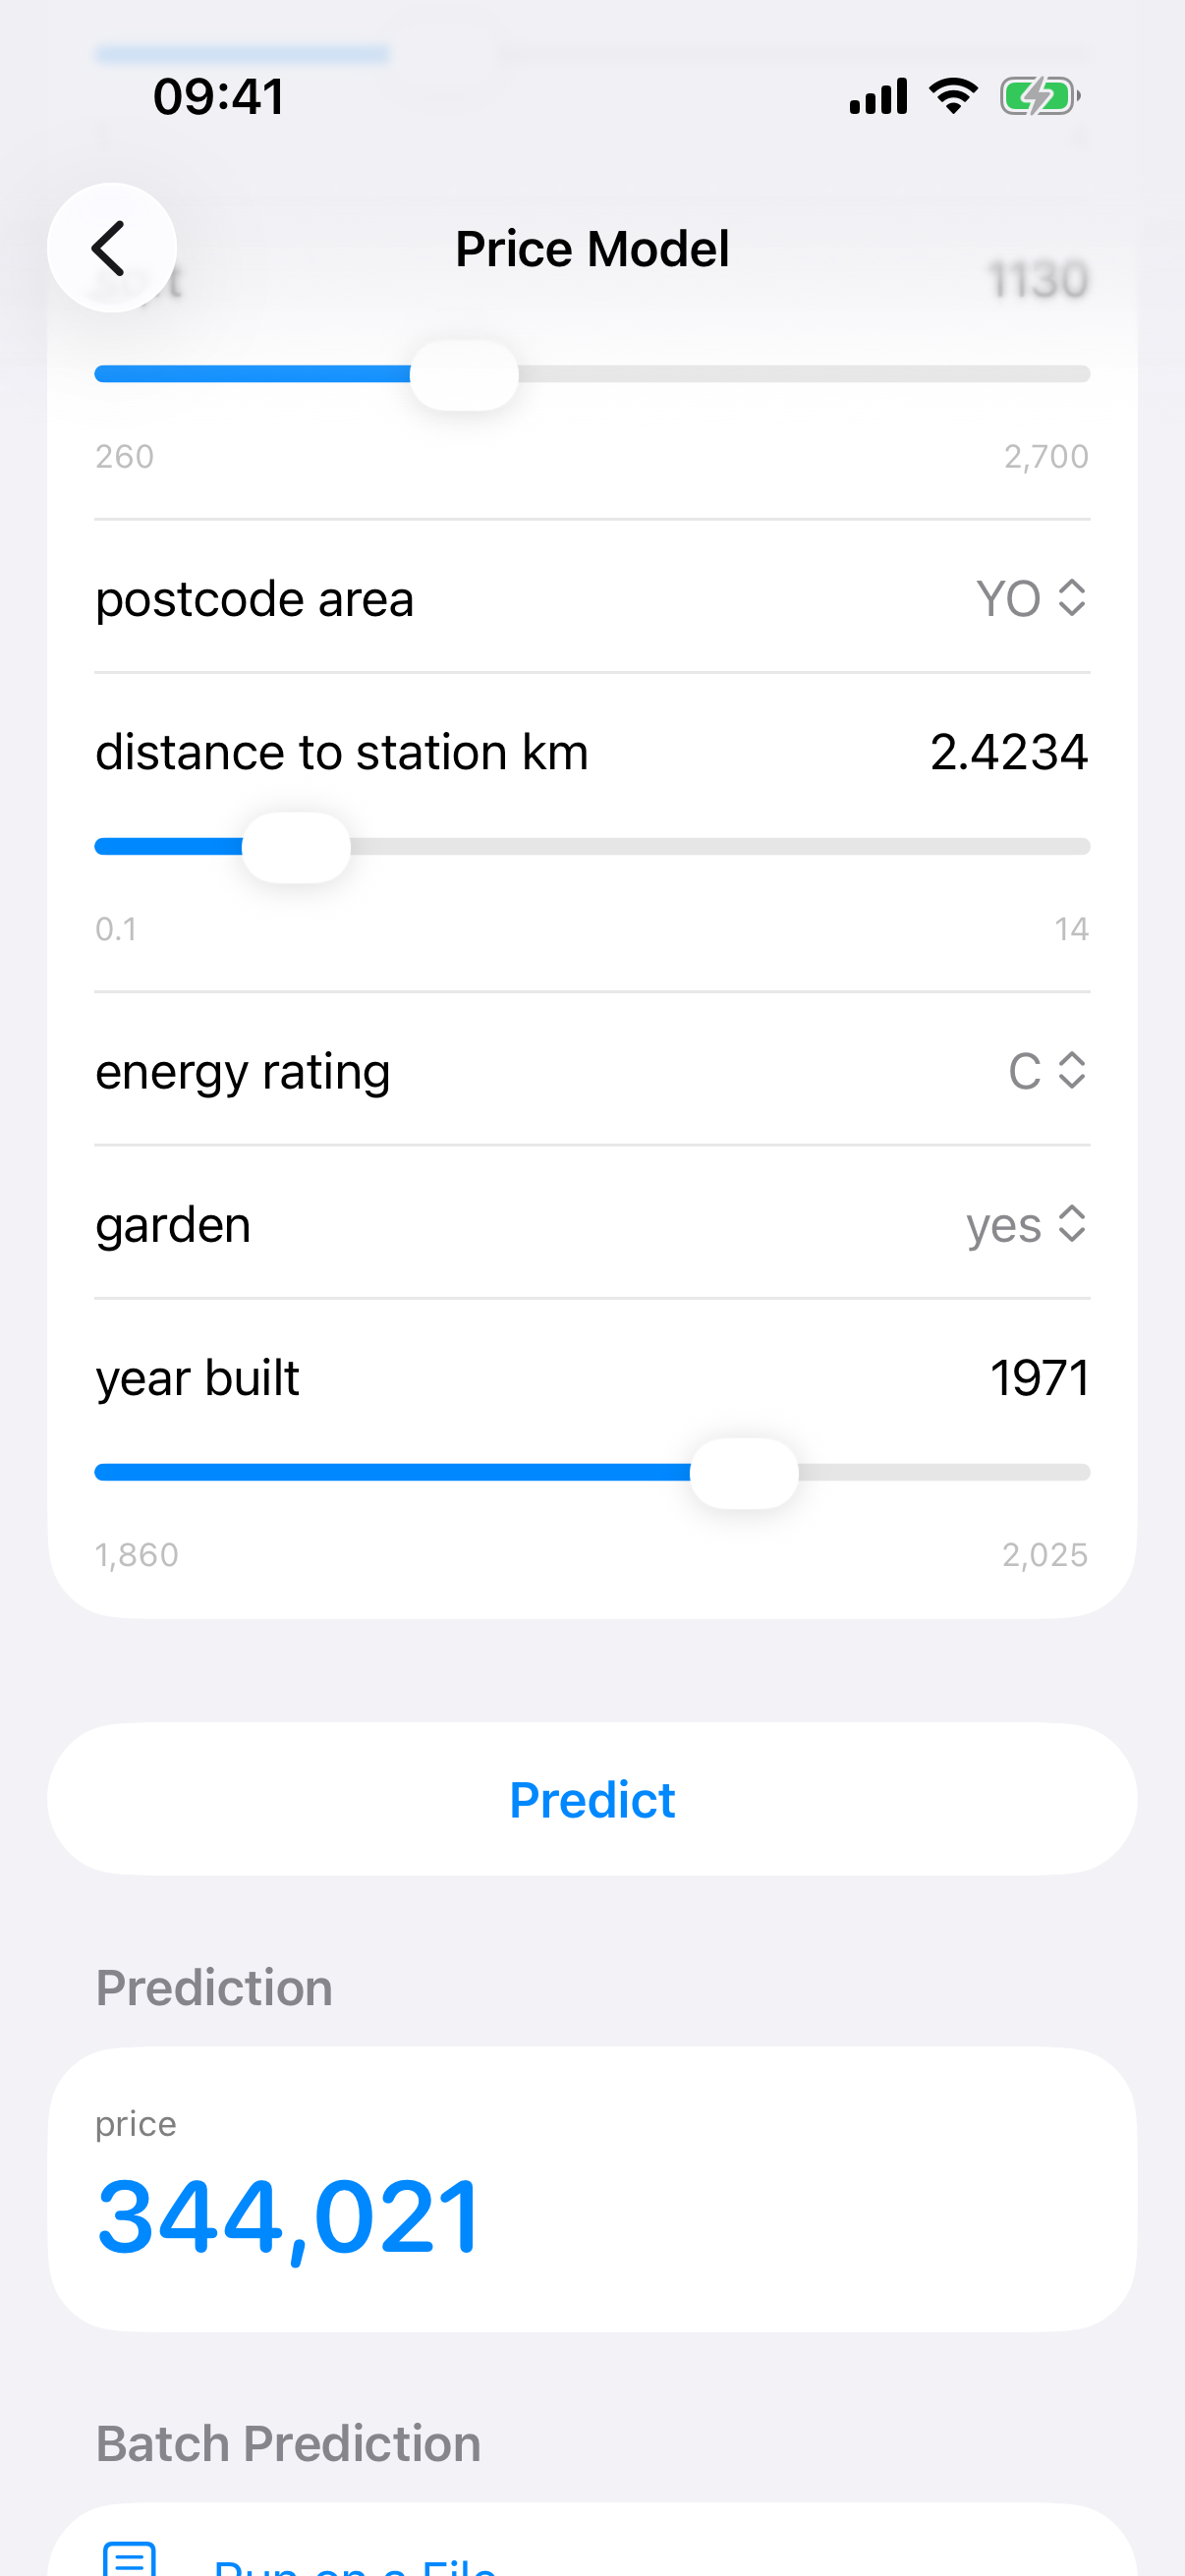
The prediction form, sliders and all, with a result.
The form arrives filled in. Numeric fields start at the column's mean and pickers start on the most common value, so a first prediction is one tap away. If any feature carries a transform, a footer reminds you to enter values in original units; the model applies its own transforms.
Tap Predict. The answer appears in large type under a Prediction heading: a number for regression, a class for classification, or "Cluster 3" for clustering. Classification models also list the probability of every class as a bar. If there are more than five classes, the caption says how many are hidden and lets you expand them, so a genuinely competitive class never falls off the bottom unmentioned.
The slider is the what-if tool
There is no separate what-if screen. Drag a slider, watch the text field follow, and tap Predict again. Ten seconds of dragging the sqft slider on the sample housing model tells you more about what it learnt than the R squared does.
Batch prediction
Below the form is a Batch Prediction section. Tap Run on a File and pick a CSV, Excel or parquet file with the same feature columns. Every row gets a prediction appended in a new column named after the target, and the file is streamed so its size does not matter. Share Results CSV hands you the result.
If the file also contains the target column, the run is scored against those actual values. You get R squared, RMSE and MAE, or accuracy, a confusion matrix, the classification report and ROC curves, all measured on rows the model has never seen. That is exactly what the Held-Out Test Files section on the Data screen is for: keep a validation split out of the data when you import, and it appears here as a one-tap Run on button.
What can go wrong
The messages are specific. A file missing a feature column names the column. A model trained on a column you have since dropped tells you to retrain. A model trained on another device that has not finished syncing asks you to give iCloud a moment. None of them are mysterious, which is the least a form can do.