Training a classification model
Quick ML: machine learning on your iPhone and iPad
2 min read
Published Sep 6 2026
Guide Sections
Guide Comments
Classification predicts a category: yes or no, which type, which group. Everything from the regression chapter applies, so this one covers only what changes. Logistic regression is free; the other eight algorithms are Pro.
Target and algorithms
Choose Classification in the Task control. The target must have between two and fifty distinct values. The nine algorithms:
Algorithm | Free or Pro |
Logistic Regression | Free |
Random Forest | Pro |
Boosted Trees | Pro |
Decision Tree | Pro |
Neural Network | Pro |
k-Nearest Neighbours | Pro |
Naive Bayes (Gaussian) | Pro |
Linear SVM | Pro |
Text Classifier (Apple NLP) | Pro |
The text classifier is the odd one out. It takes exactly one text feature column and learns from the words in it, using Apple's natural language framework, which makes it the right tool for sorting reviews, tickets or messages into categories.
Class balance
A new section appears: Class Balance, with a picker offering Off, Oversample and SMOTE. If the largest class has more than three times the rows of the smallest, an orange warning tells you that accuracy alone will mislead and suggests balancing. Oversample duplicates rows of the minority classes; SMOTE synthesises new ones between neighbours. Both apply to the training split only, so the test set stays honest.
The split is stratified for you
You do not need to do anything for this. When the target is a category, the random split keeps each class in the same proportion in both halves and guarantees every class has at least one training row. The rule is stamped on the model, so re-analysing it later replays the identical split.
Reading the result
The Test Set Performance section shows accuracy, then a classification report in the same shape pandas users will recognise: one row per class with precision, recall, F1 and support, then macro and weighted averages. The footer explains each in a sentence, which saves a trip to the glossary.
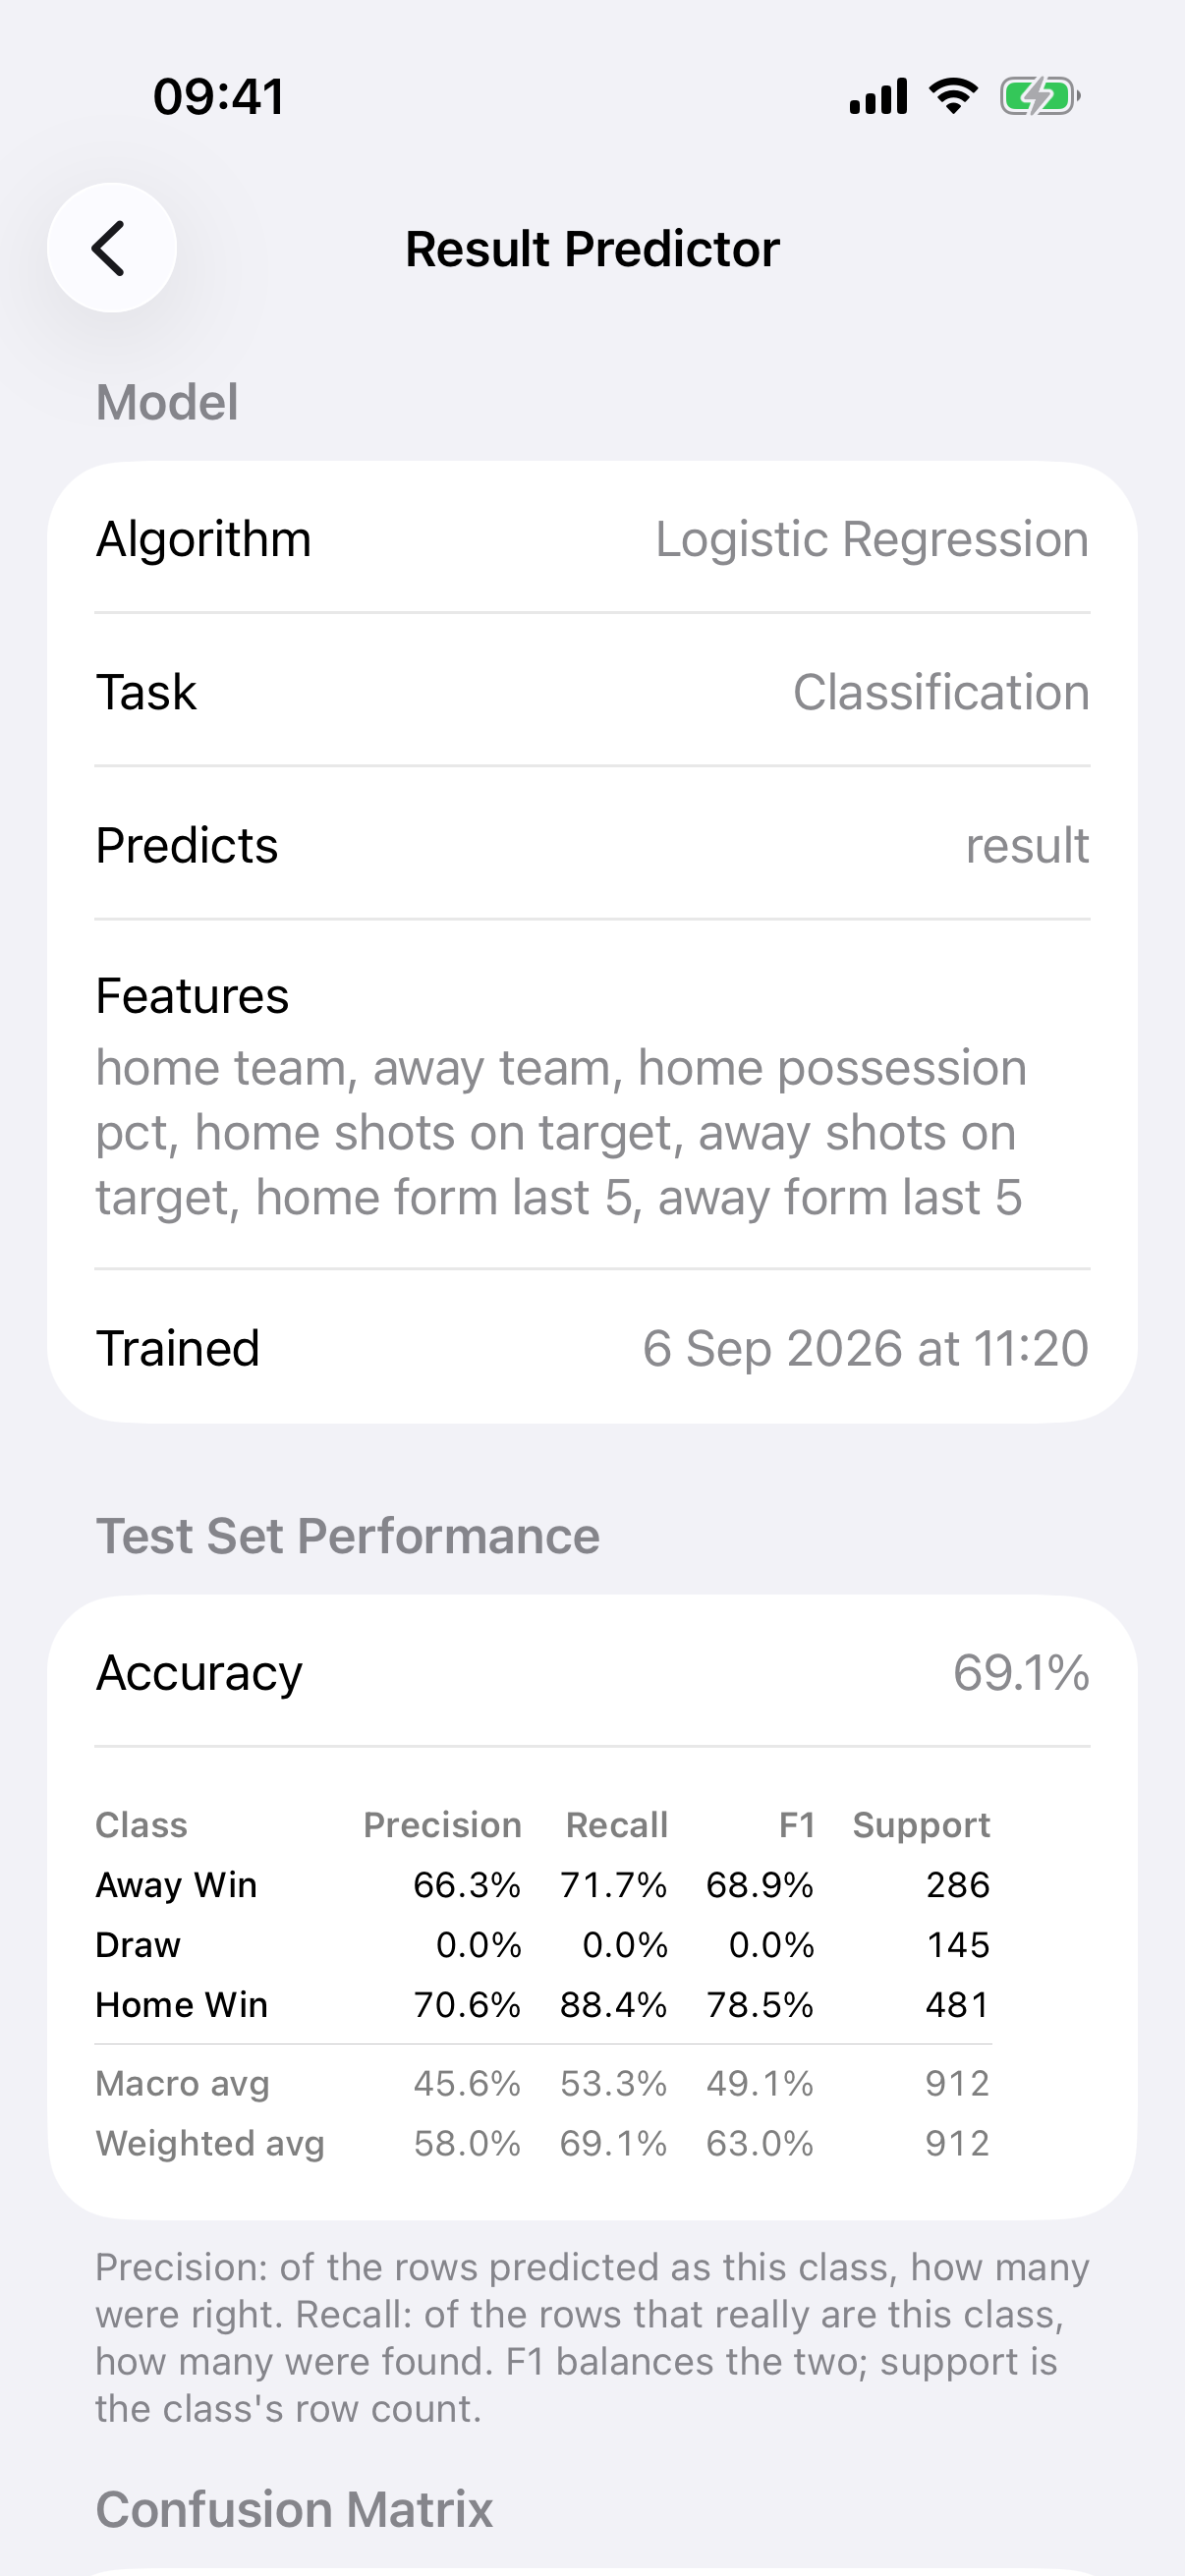
A classification model with its classification report.
The Confusion Matrix puts the actual class on the rows and the predicted class on the columns, with the class names written along the diagonal where the correct predictions sit. Compute ROC Curves draws one curve per class and reports the area under each. An AUC of 1 is perfect separation and 0.5 is guessing. The values are cached on the model, so they appear instantly next time and feed into the Compare Models screen.
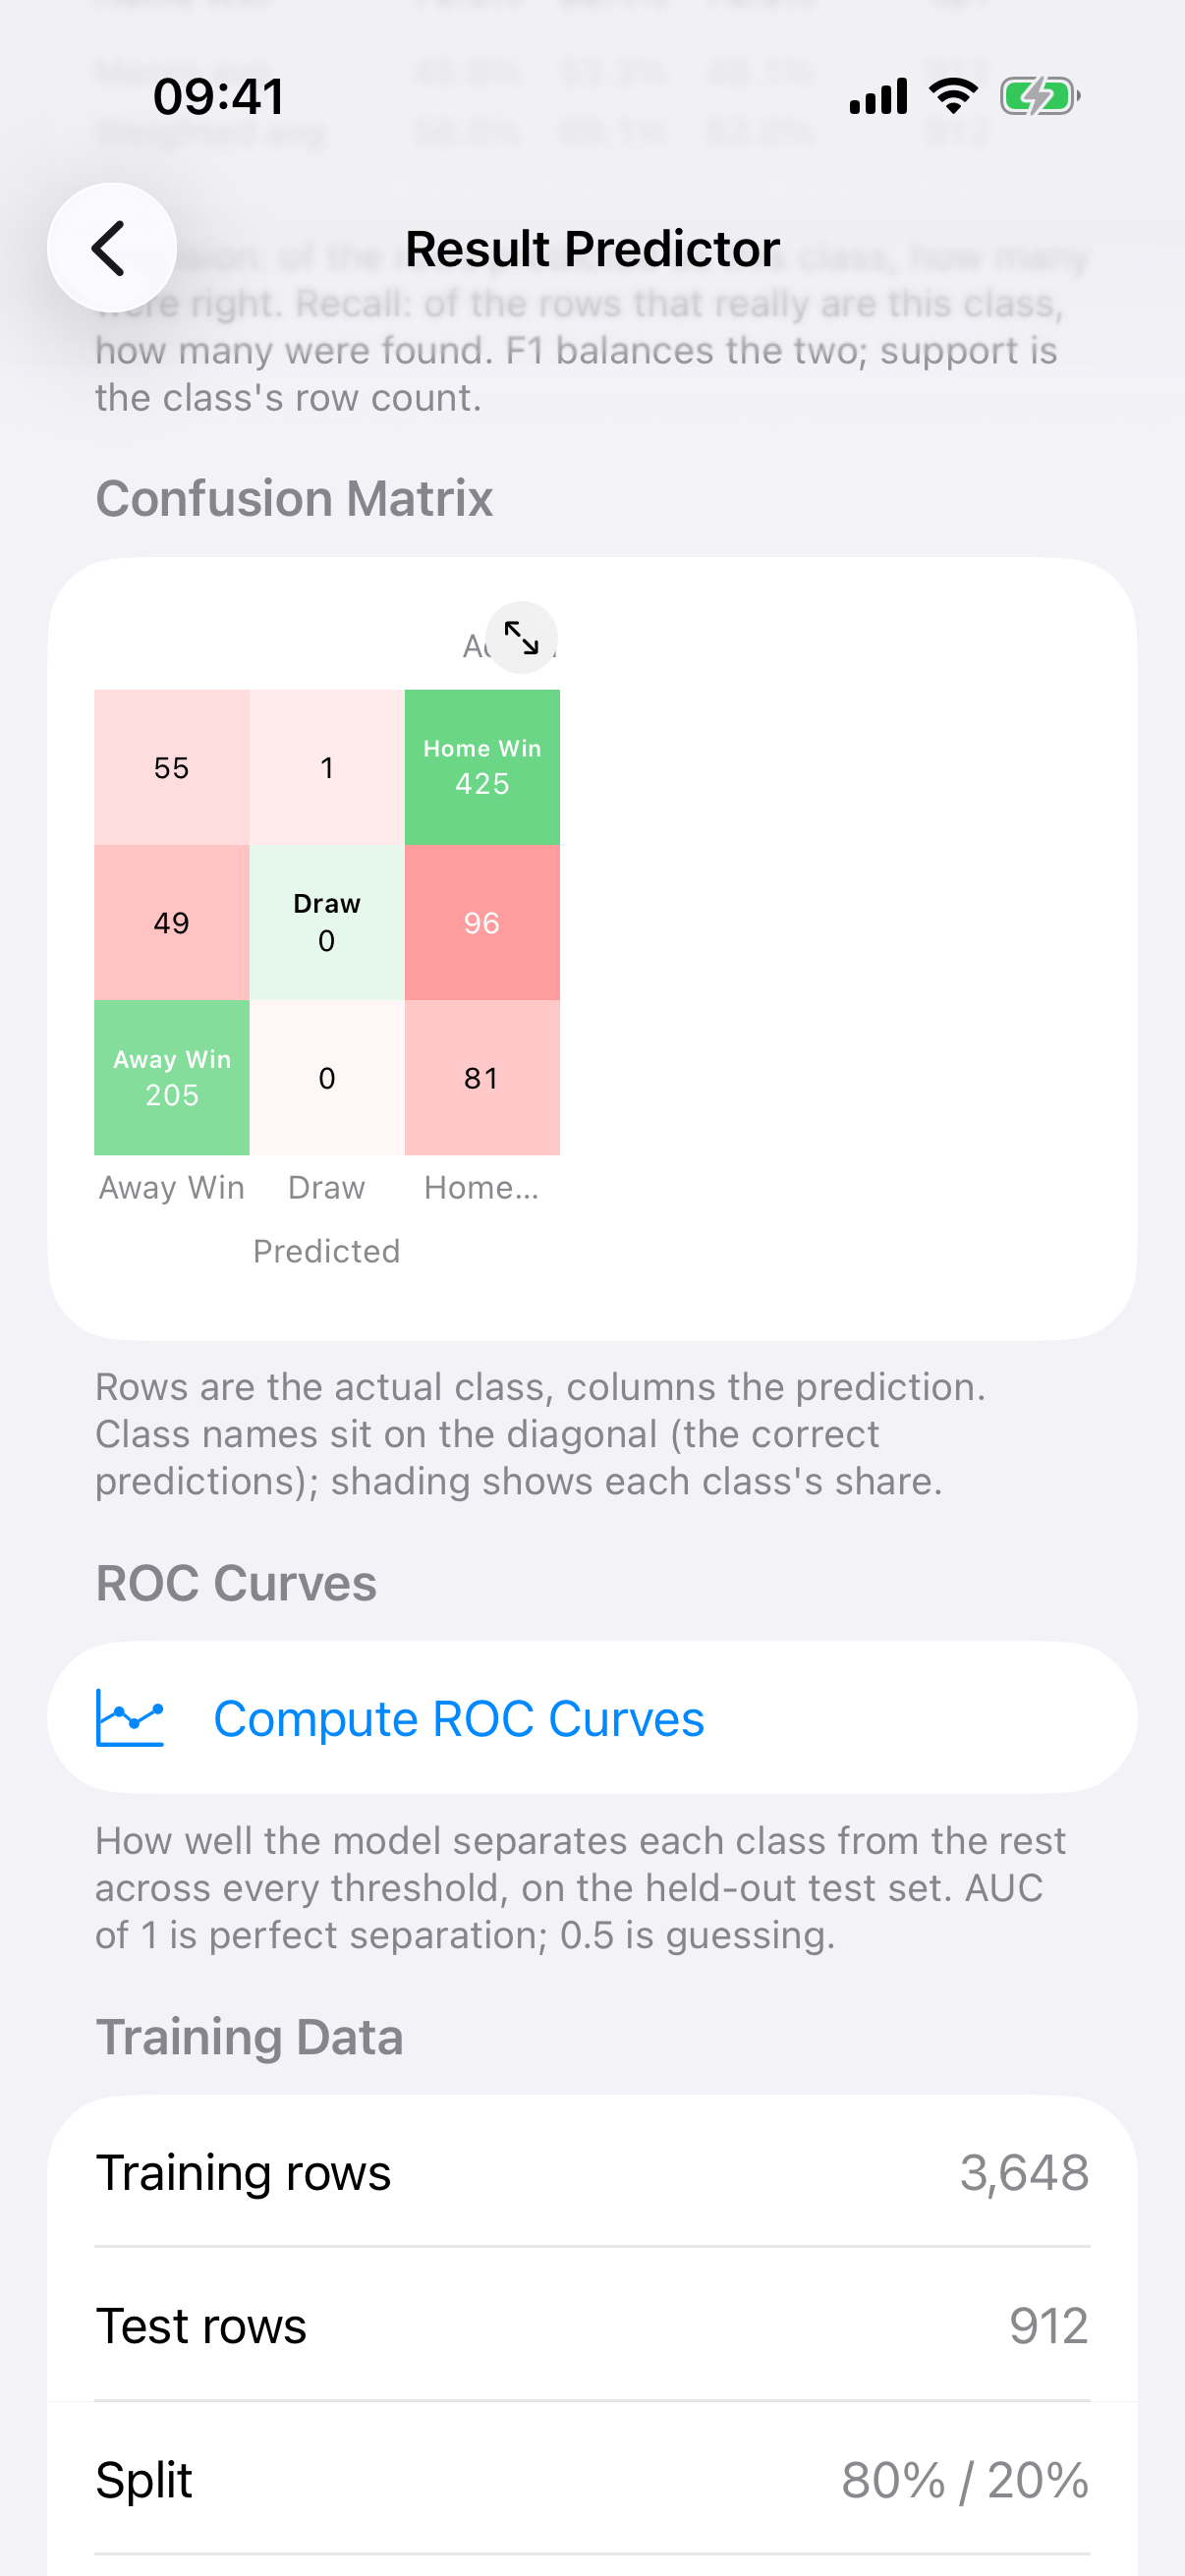
The confusion matrix, class names on the diagonal.
A tip on what to leave out
The demo project I use for the App Store screenshots predicts football results from possession, shots and form. It deliberately leaves the goals out of the features, because the goals decide the result and a model that reads them has learnt nothing. When your accuracy looks too good, check whether one of your features is quietly the answer.