Training a regression model
Quick ML: machine learning on your iPhone and iPad
5 min read
Published Sep 6 2026
Guide Sections
Guide Comments
Regression predicts a number: a price, a score, a quantity. It is the first model most people train, and with the sample data you can have one in under a minute. The free version includes linear regression, so nothing in this chapter needs Pro unless it says so.
Getting to the setup screen
From the project screen tap Train, then Train a New Model. The setup screen is one long form, and the sections come in the order below.
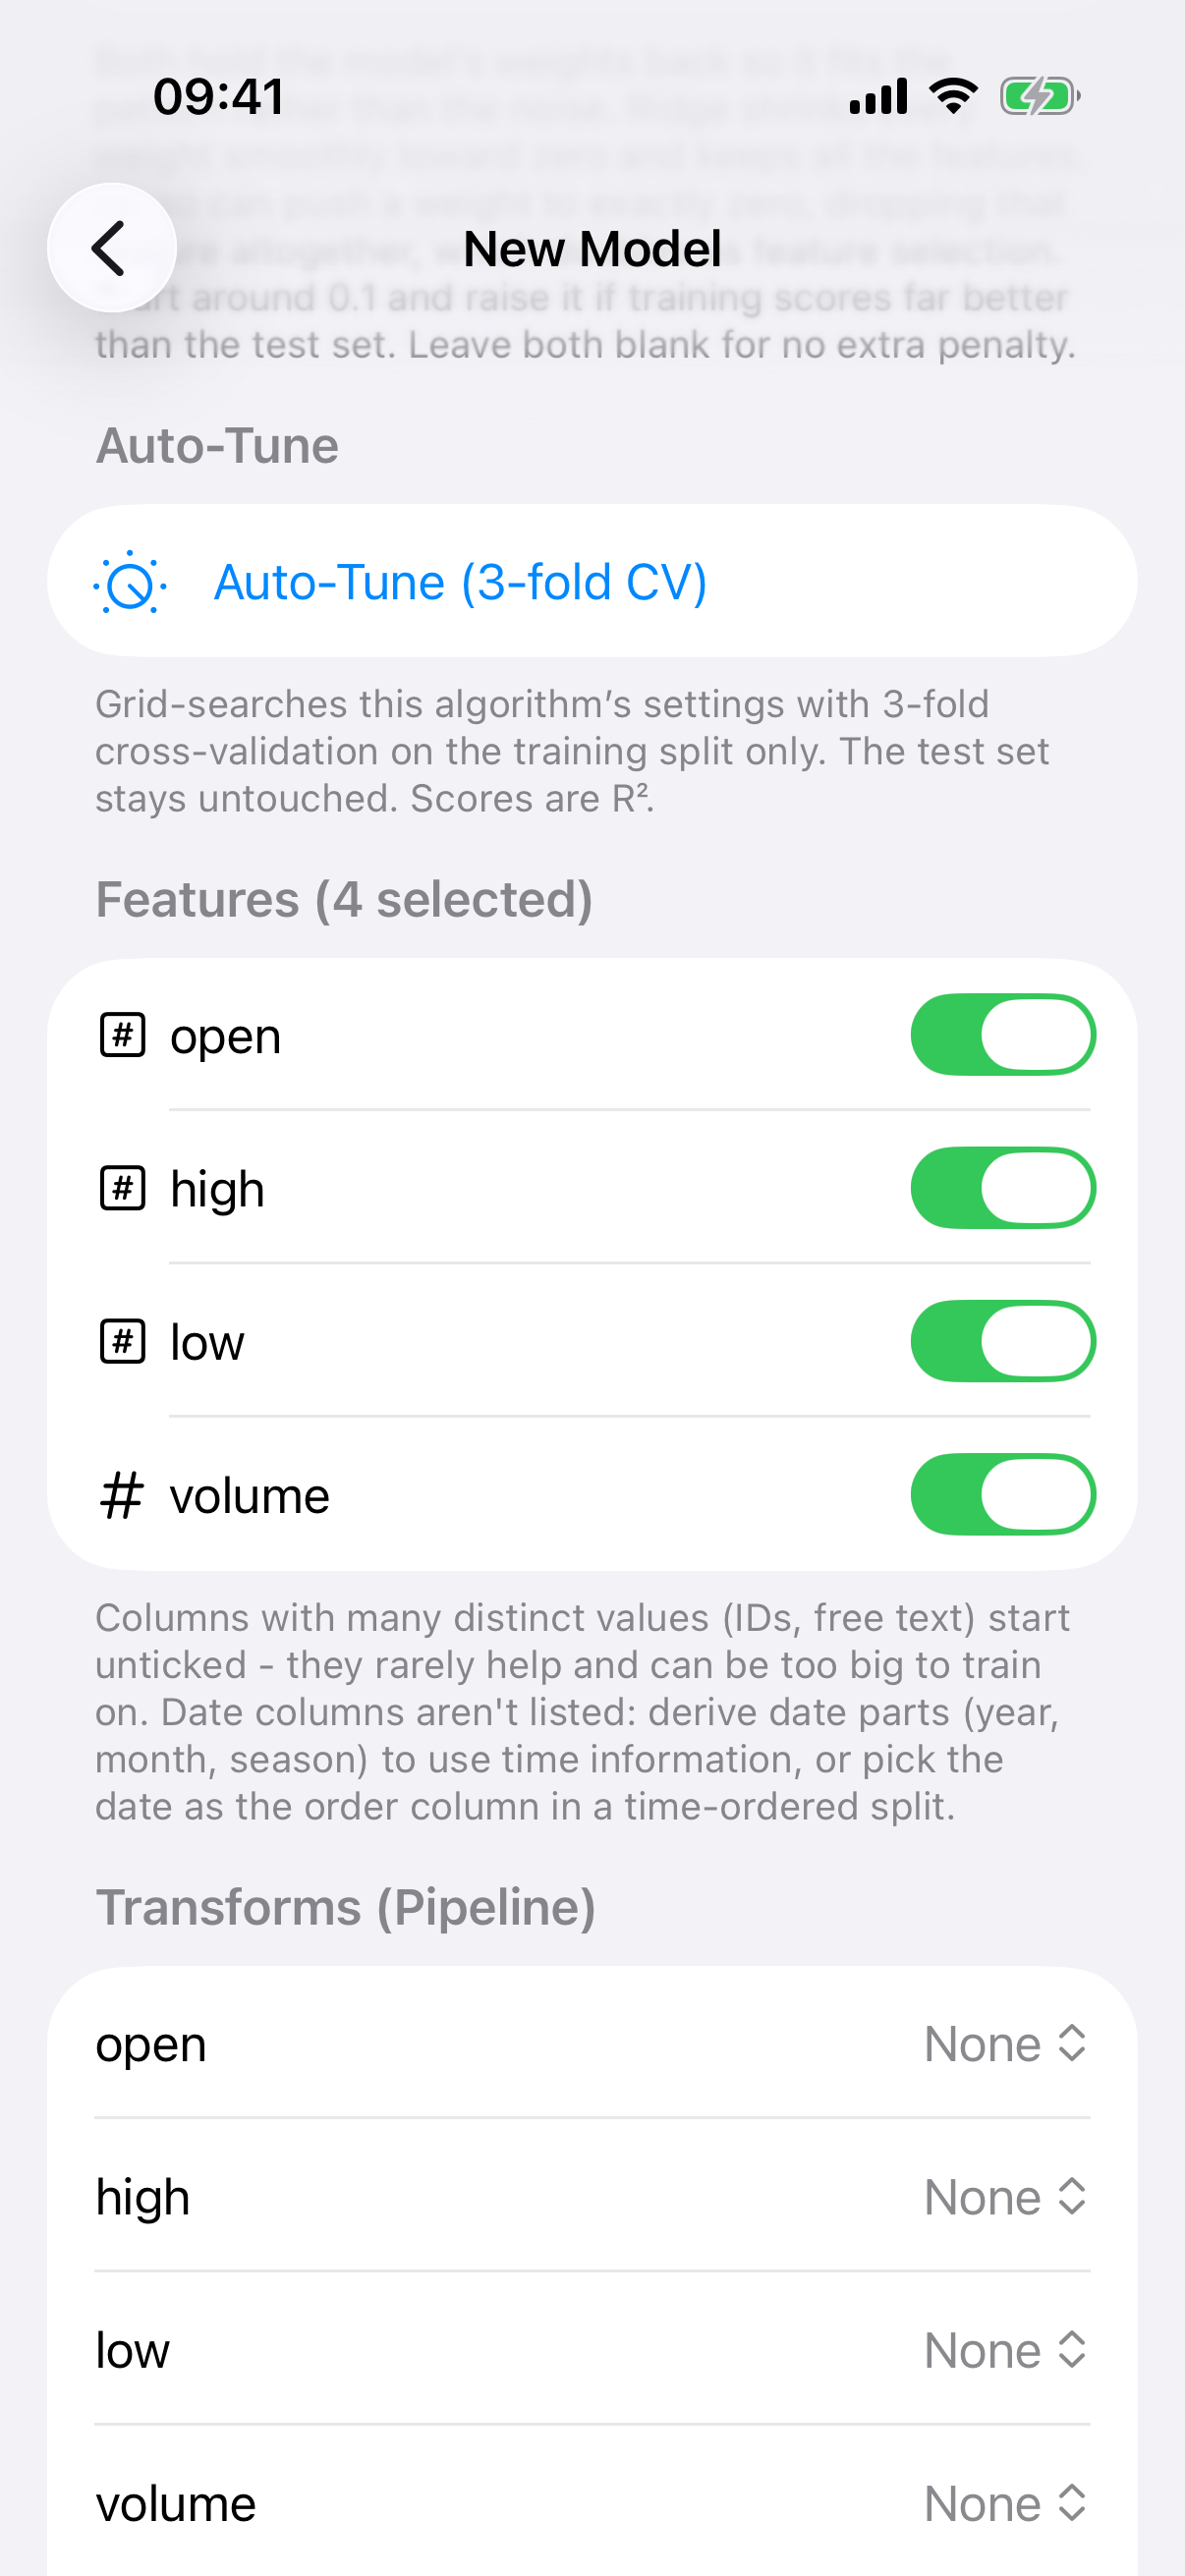
The New Model screen: Auto-Tune, features and transforms.
Task and target
The Task control offers Regression, Classification and Clustering. Choose Regression. Then tap Target Column and pick the number you want to predict. For the sample data, that is price.
Algorithm
Five regression algorithms are listed: Linear Regression, Random Forest, Boosted Trees, Decision Tree and Neural Network. Linear regression is free; the other four are Pro, and they show greyed with a padlock rather than being hidden, so you can always see what is there.
Each algorithm has its own options section. Linear regression offers Ridge and Lasso regularisation. The trees offer depth, count, learning rate and sampling, with blanks meaning Create ML's defaults. The neural network gets a small designer: hidden layers with a neuron count each, an activation function, epochs, learning rate, dropout and weight decay, with a footer explaining what the last two are for.
Features
The Features section lists every column as a toggle, with its type icon and colour tag. Numeric columns, ordinal columns and categories with up to fifty distinct values start ticked. Columns with many distinct values, like ids and free text, start unticked because they rarely help and can be too big to train on. Date columns are not offered as features at all: derive year, month or season from them in the column explorer, or use the date as the order column in a time-ordered split.
Transforms
For each numeric feature, and for the target, you can choose None, Log, Square Root, Square or Reciprocal. The footer gives the rule of thumb: log or square root for right-skewed columns such as prices and counts, square for left-skewed, reciprocal for heavy tails. Transforms are saved with the model and applied to every prediction, and target predictions are converted back into original units. You never need to standardise by hand, because the app does it automatically for the algorithms that care.
The train and test split
The Training share slider runs from 50% to 95%. The Method control offers Random, with a shuffle seed so the same split happens on every device, or Time-Ordered, which trains on the earliest rows and tests on the latest. Time-Ordered is the honest choice for anything with a date in it, and it is what turns on the Forecast chart in the last chapter.
How many rows will it use
Under the Train button is a sentence I am rather proud of. It tells you how many rows your data has and how many this particular device can comfortably train on with these particular features, worked out from the device's memory and the measured width of the columns you ticked. If your data fits, it says so. If it does not, it tells you training will sample down and that the model's page will show exactly how many rows were used. No number is hard-coded, so a big iPad trains on far more rows than a small phone.
Auto-Tune
Auto-Tune is a Pro feature that grid-searches the algorithm's settings with three-fold cross-validation on the training split only, then writes the best configuration back into the fields above. The test set is never touched. Time-ordered splits get an expanding-window cross-validation automatically, so the tuning never peeks at the future either.
Train
Tap Train Model. Progress messages keep you informed, including an honest "Create ML doesn't report progress, but it hasn't hung" for the tree models. Algorithms the app implements itself, such as the neural network, offer Stop and Keep Model, which evaluates whatever has been trained so far. When training finishes the setup screen dismisses itself and the new model appears in the Trained Models list with its headline metric.
Reading the result
Tap the model. The Test Set Performance section shows R squared, RMSE and mean absolute error, measured on the held-out test rows and in the target's own units. R squared of 1 is a perfect fit and 0 is no better than guessing the average.
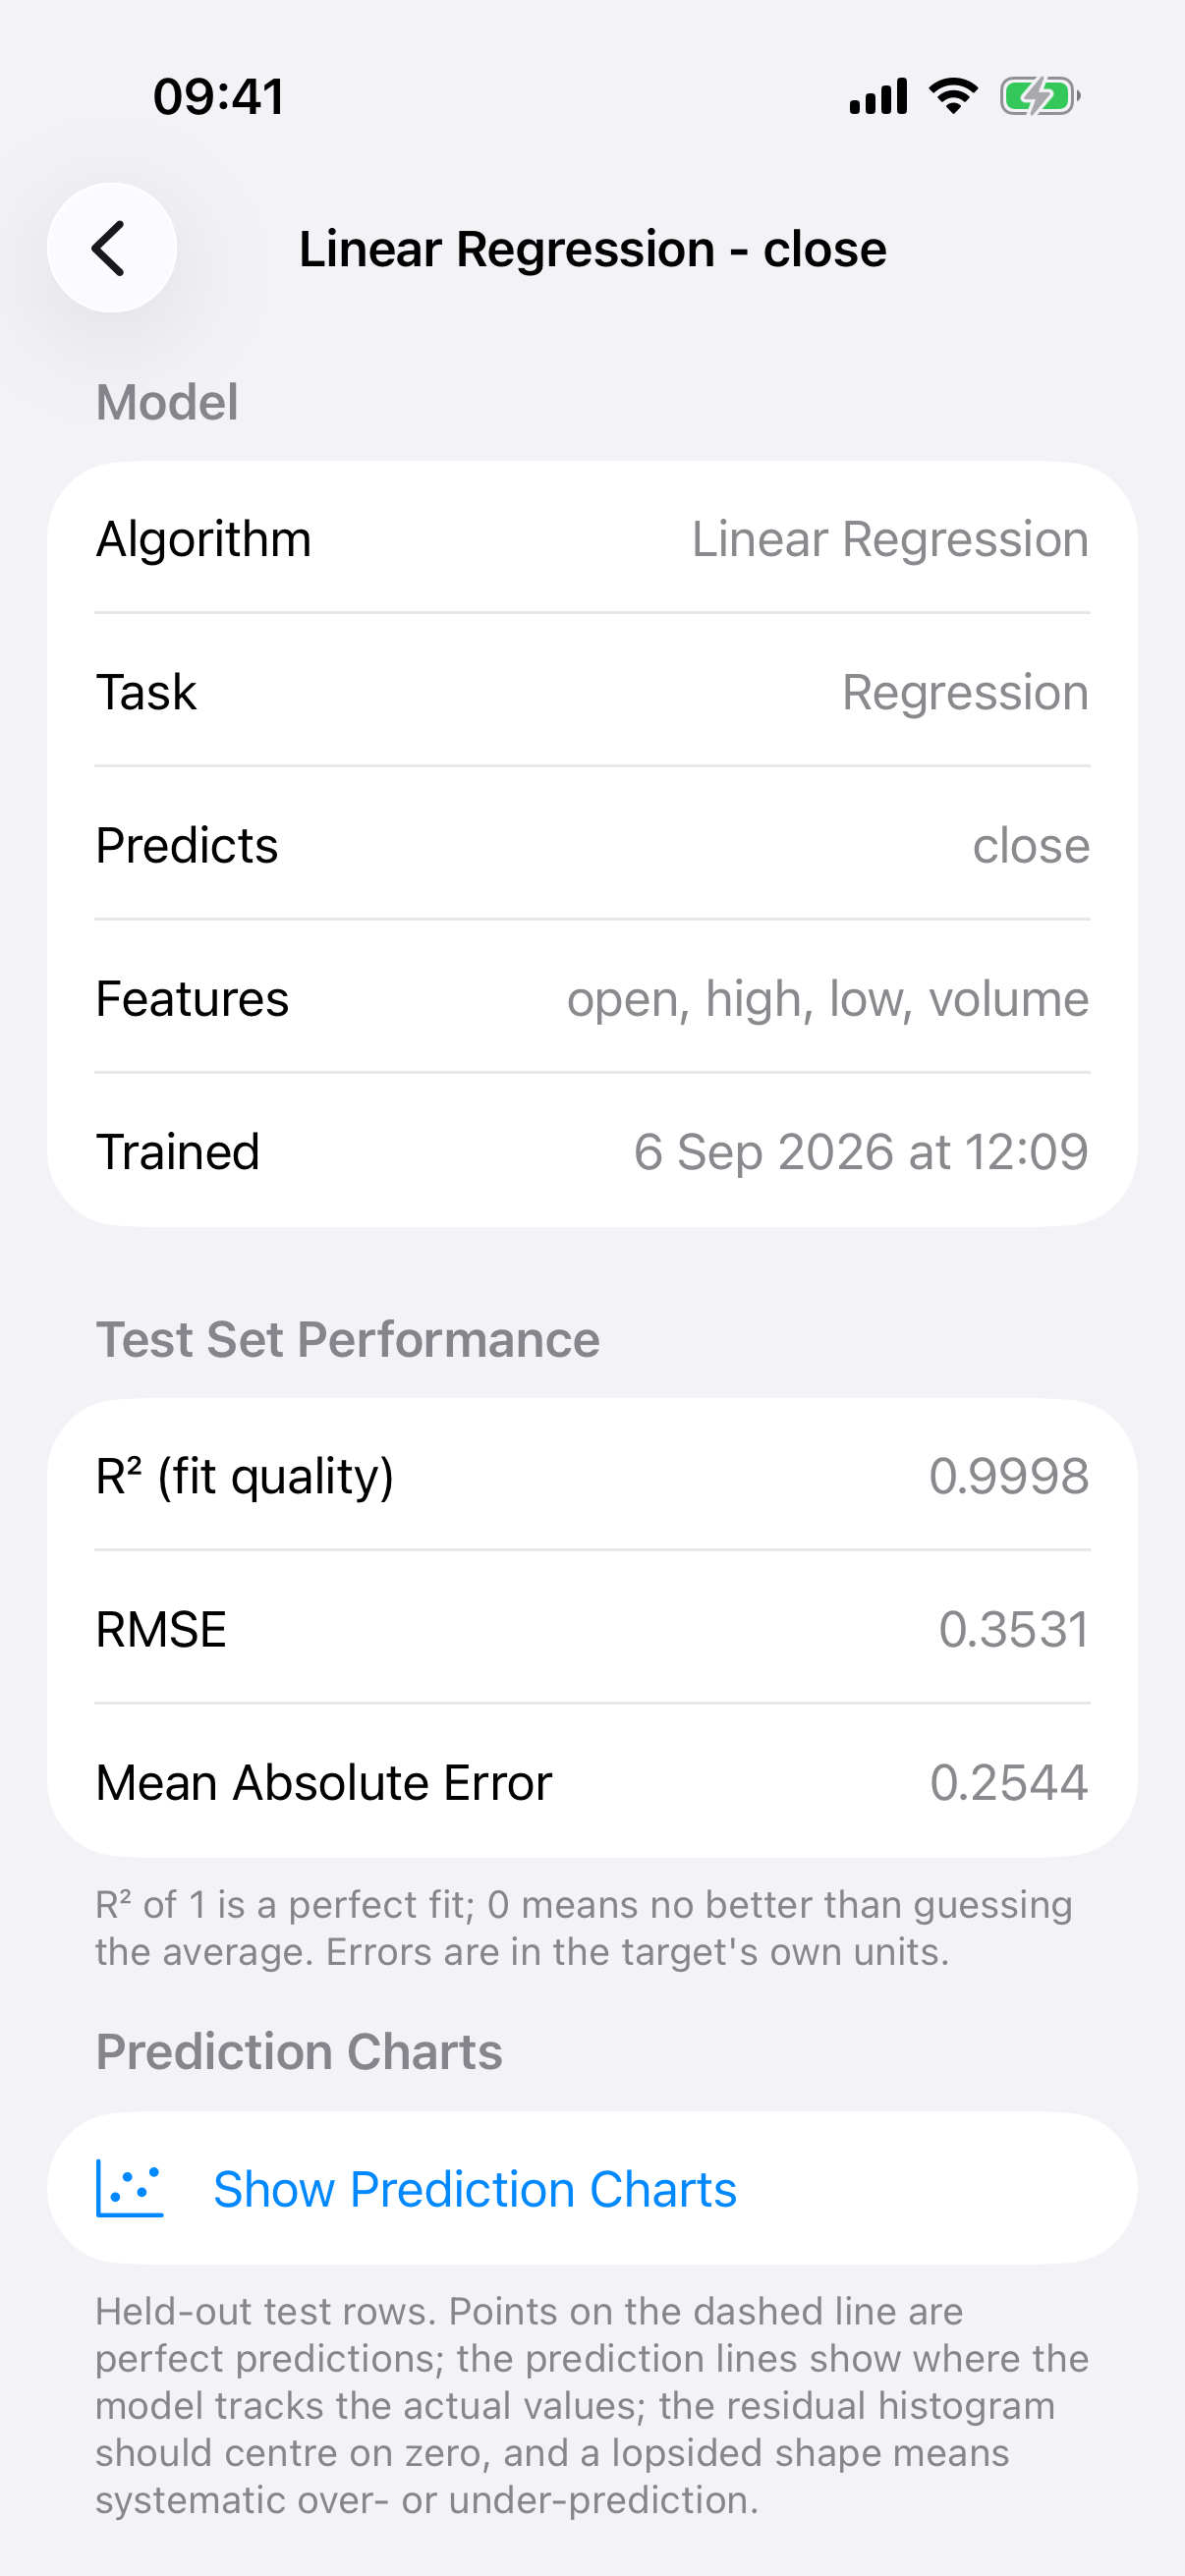
A regression model's Test Set Performance.
Show Prediction Charts reveals three charts: actual against predicted with a diagonal of perfection, the two lines over the rows sorted by actual value, and a histogram of residuals that should centre on zero. Compute Feature Importance shuffles each feature on the test set and measures how much R squared drops, which tells you what the model actually leans on.
Further down, Retrain on Current Data runs the same configuration against the data as it is now, after new cleaning steps or a refresh, and records the result as the next version.