Your first project and your first file
Quick ML: machine learning on your iPhone and iPad
4 min read
Published Sep 6 2026
Guide Sections
Guide Comments
This chapter takes you from an empty app to a project with data in it. If you want to follow along without hunting for a CSV, the app ships with a sample file, and I will point out where it is.
Creating a project
Open Quick ML and you land on the Projects list. Tap New Project, give it a name (the placeholder suggests House Prices, which is a hint about the sample data) and, if you like, a one-line description of what you are investigating. Tap Create.
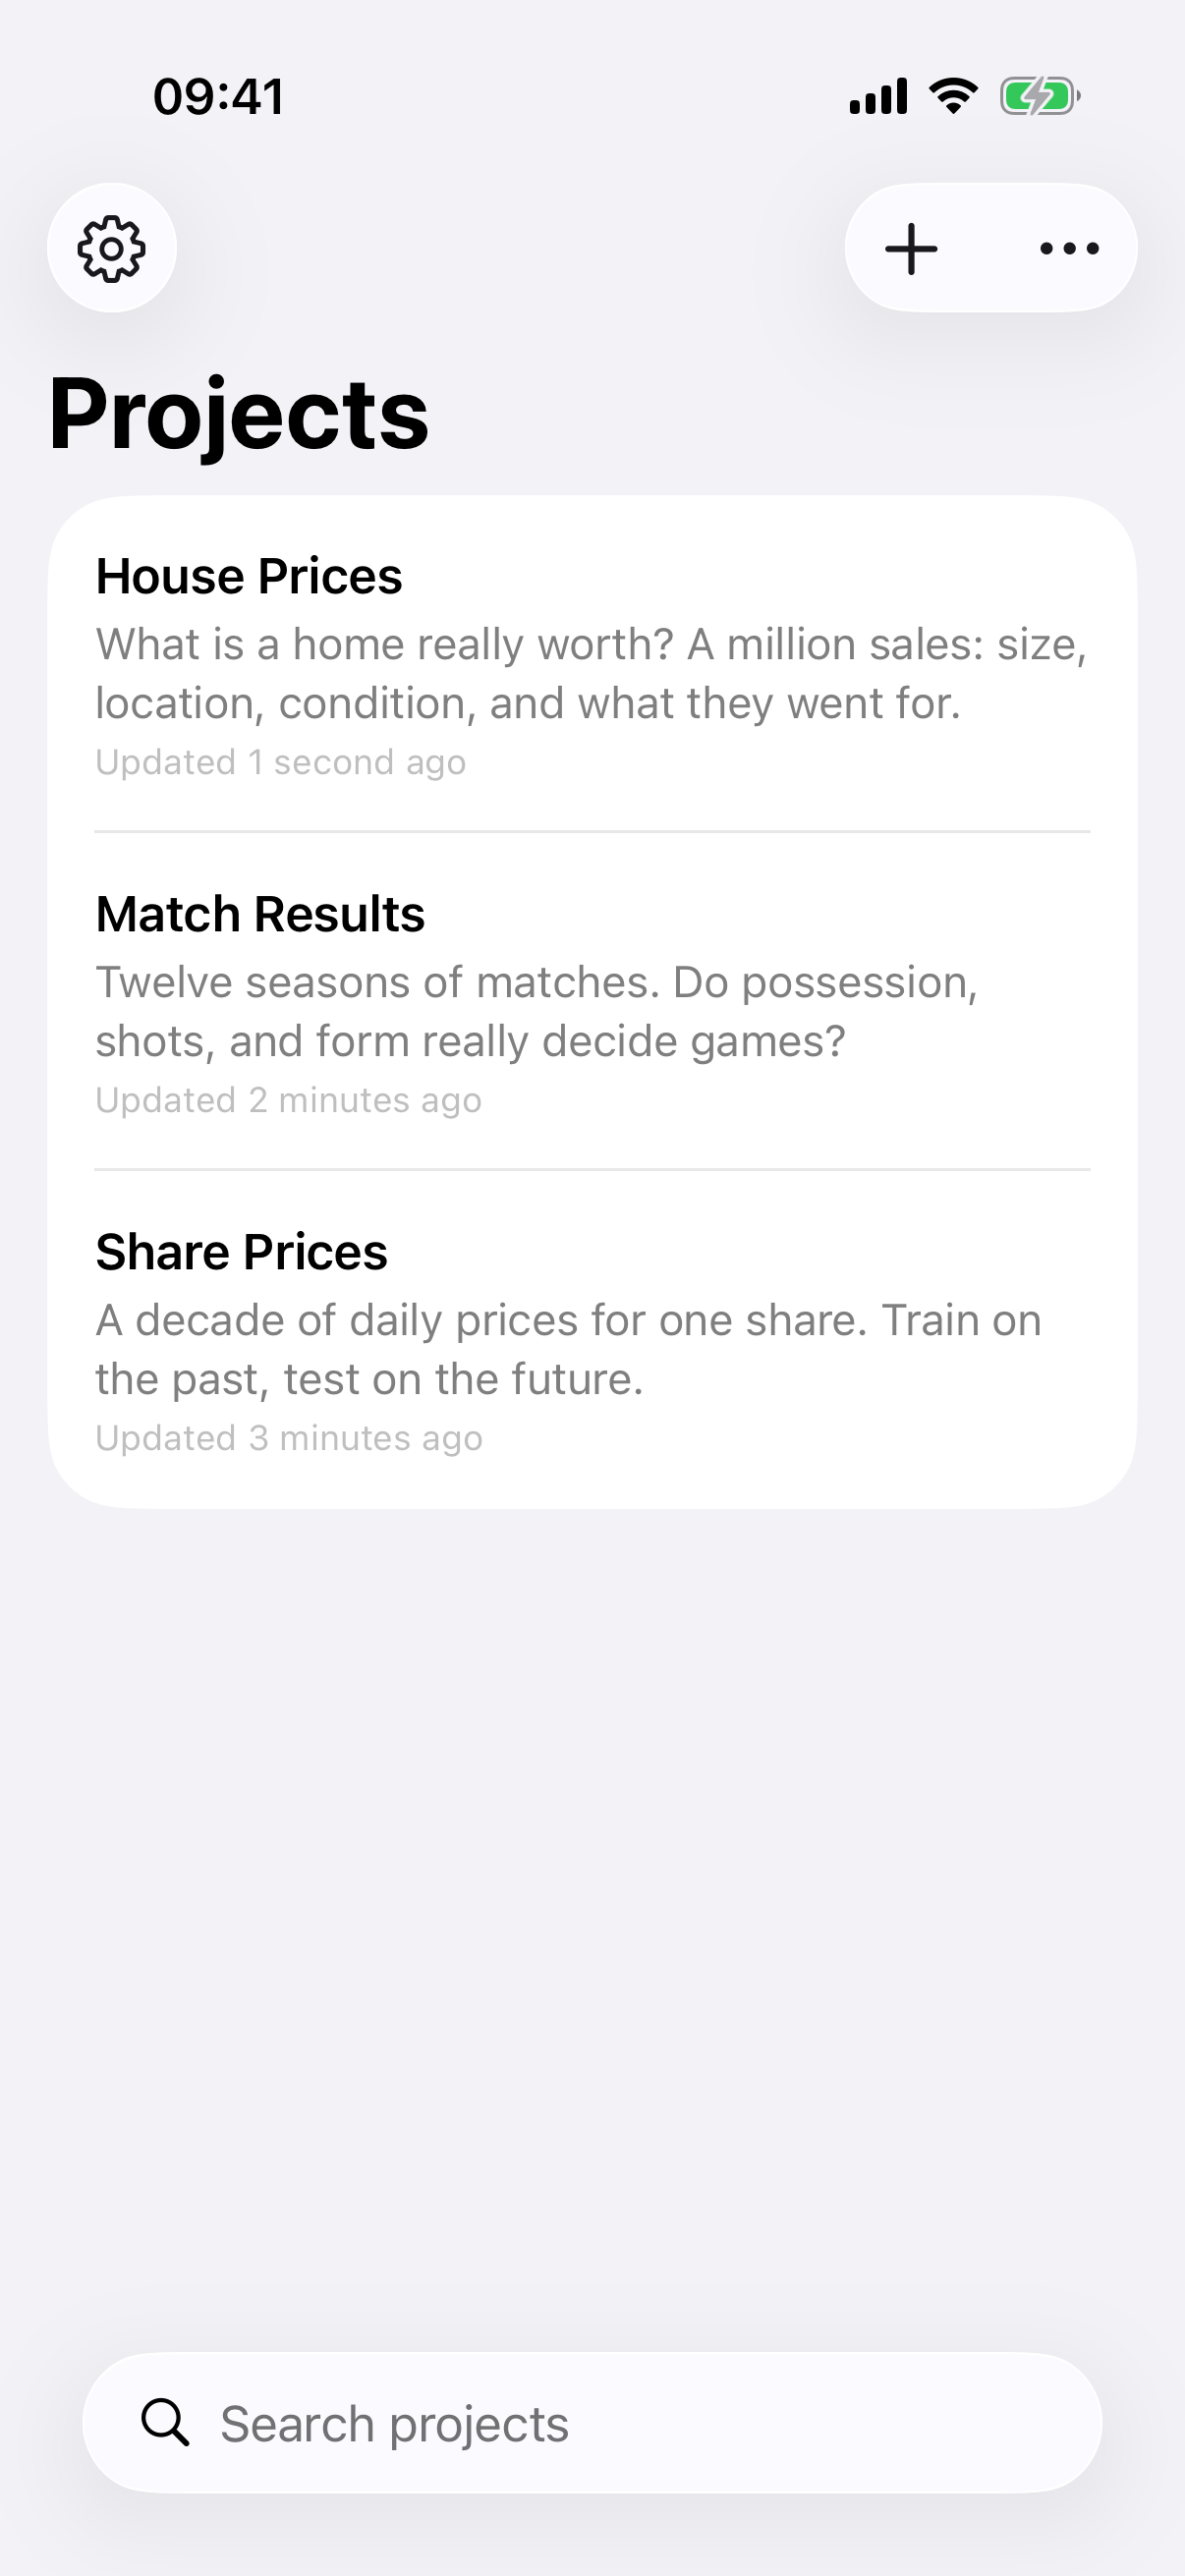
The Projects list.
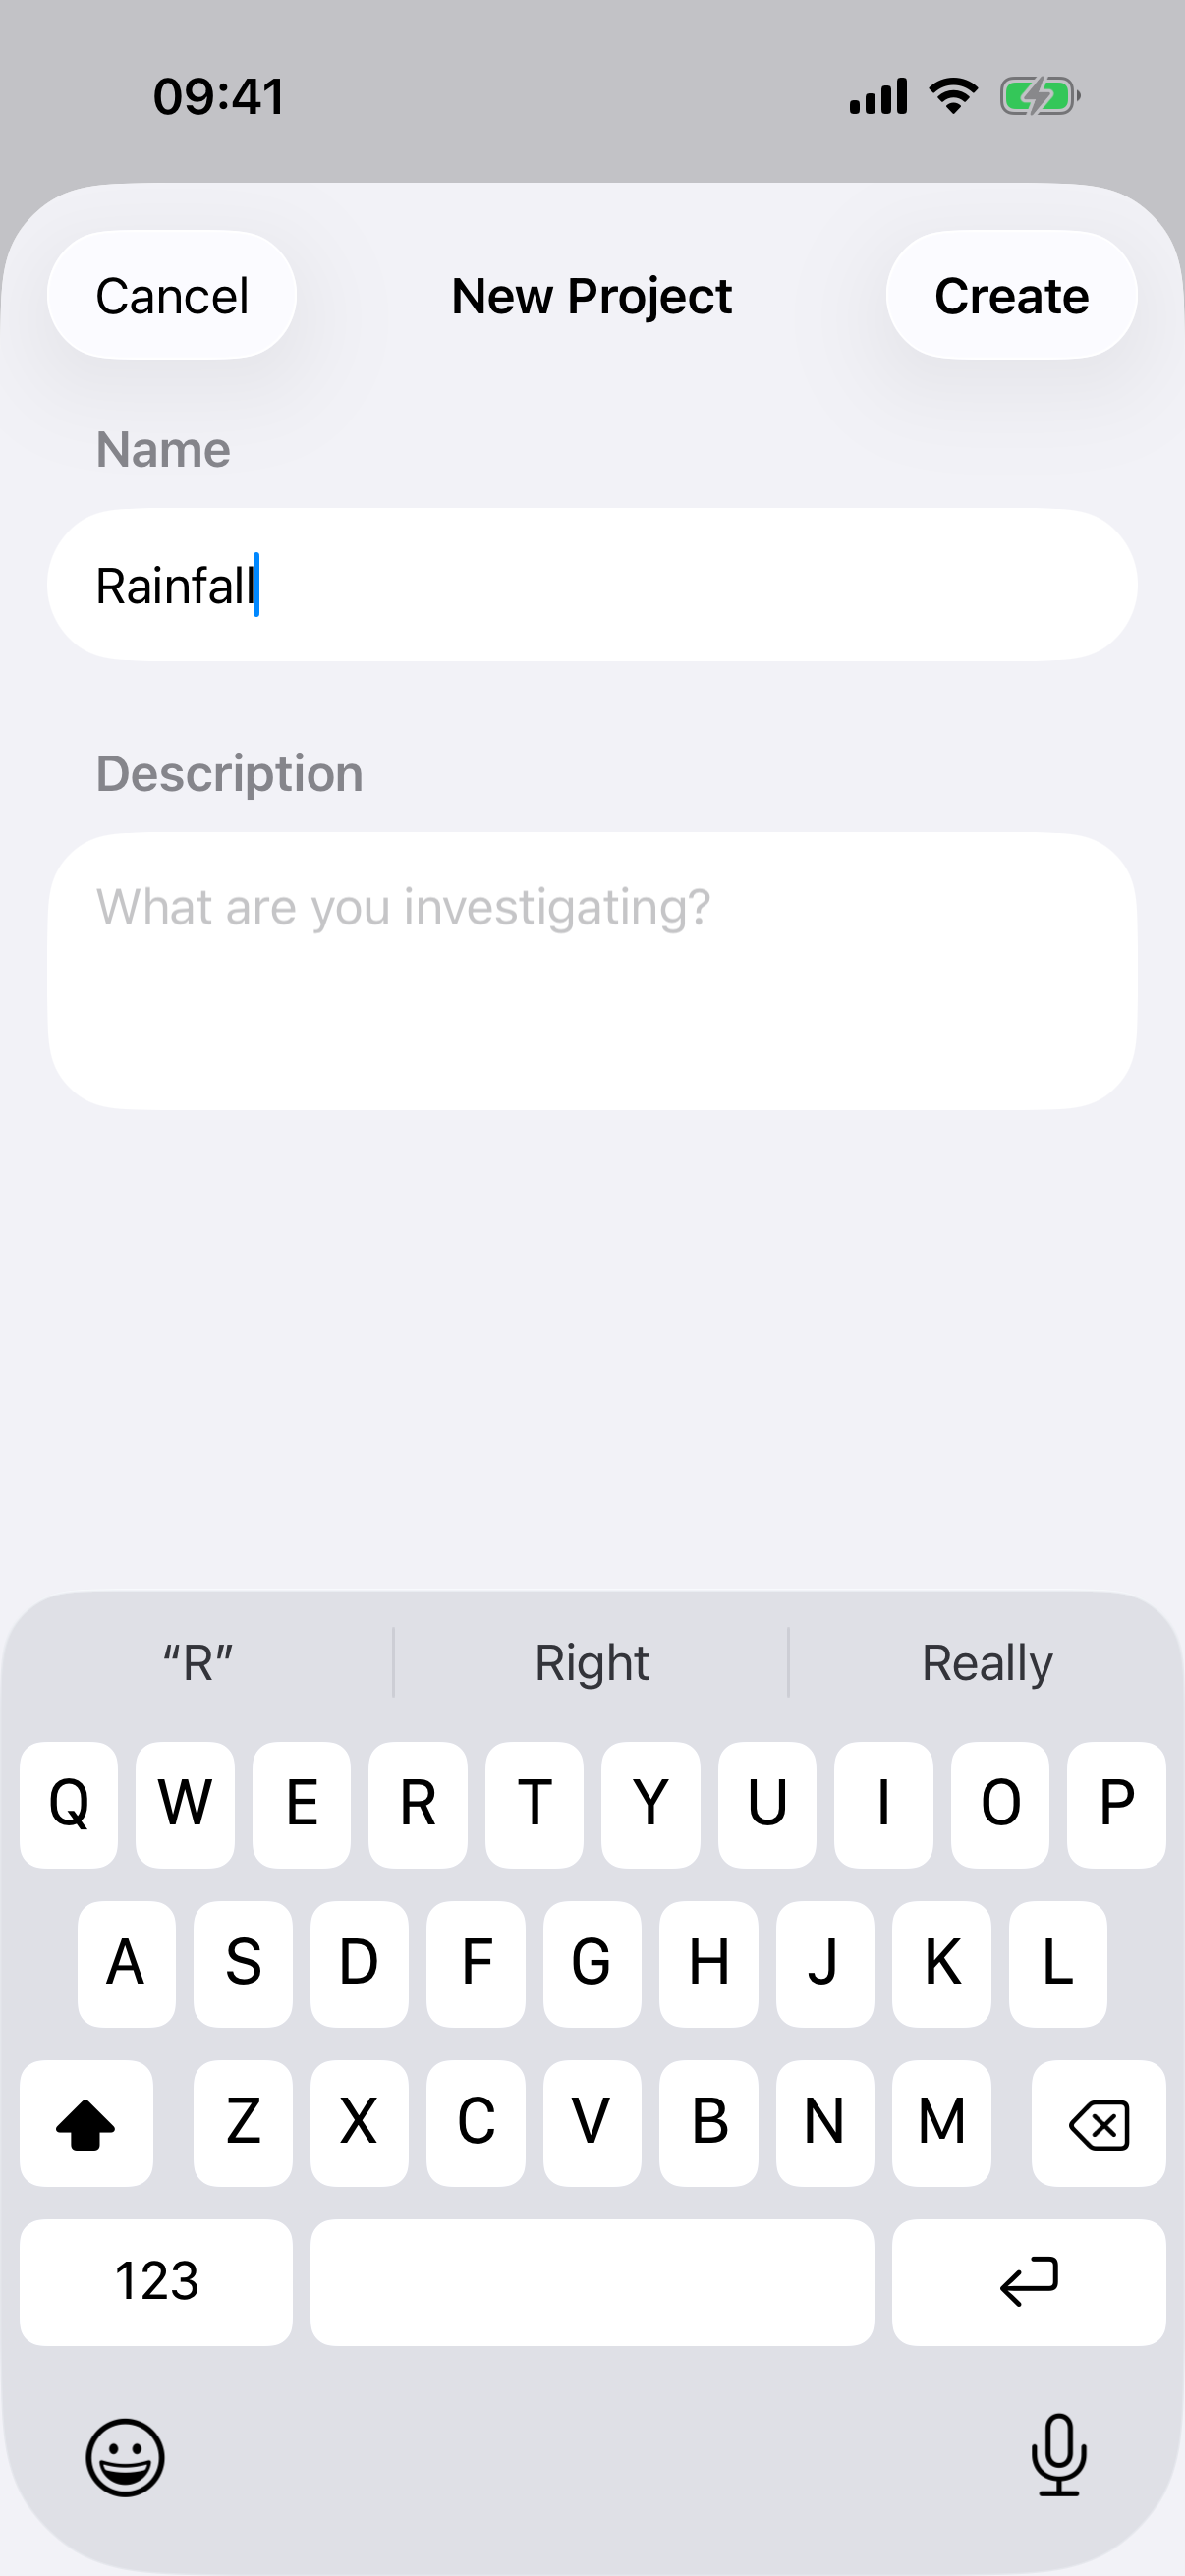
The New Project sheet.
The project screen opens with a Workflow section holding three rows: Data, Train and Predict. Only Data is available to begin with. Train says "Import data first" and Predict says "Train a model first", and each unlocks as you go. Once data is in, a Dashboard row, a Report section and a Share Project section appear below the workflow.
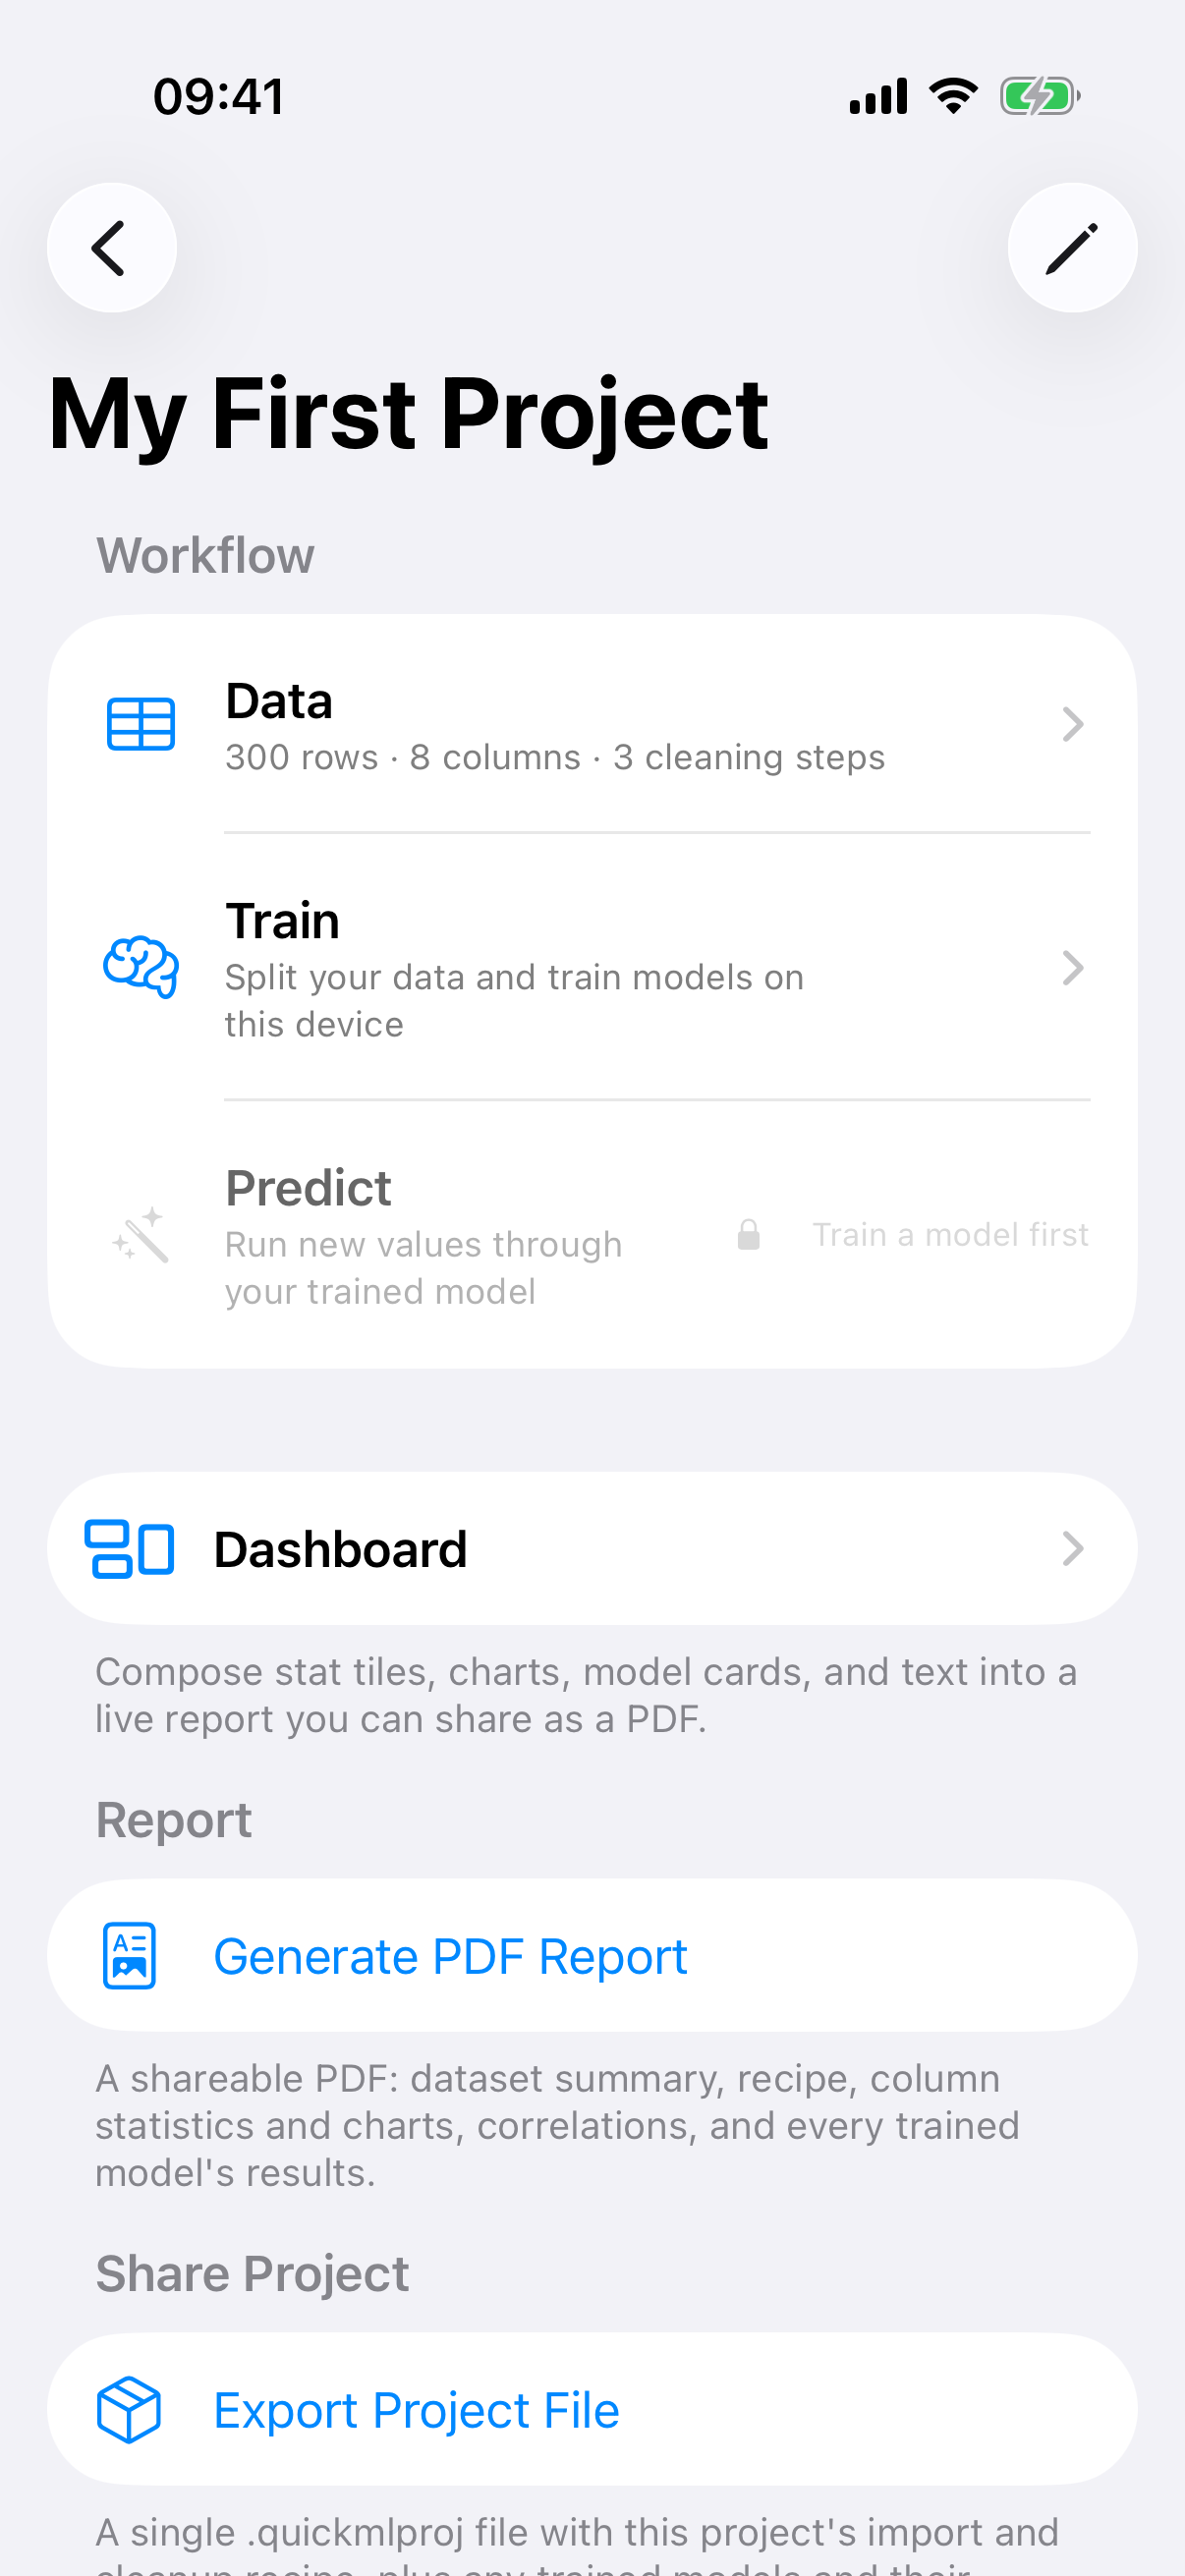
A new project's Workflow: Data is ready, Train and Predict unlock as you go.
Three projects on the free version
The free version allows three projects at a time. The fourth tap on New Project opens the Quick ML Pro sheet instead of the editor. Deleting an old project frees up a slot.
Choosing where the data comes from
Tap Data and you get a screen titled Set Up a Data Source with seven buttons. Here is what each one does and whether it needs Pro.
Button | What it does | Free or Pro |
Choose a File | CSV, TSV, Excel, parquet, Word, PDF, JSON, XML or ZIP | Free |
Choose a Folder | A folder of images sorted into class subfolders | Free |
Import From the Web | A web page with a table, a data URL, a JSON or XML API, or GraphQL | Pro |
Import From Kaggle | Search Kaggle and download a dataset | Pro |
Combine Two Projects | Join two existing projects on a shared key column | Free |
Import From PostgreSQL | Pull a table, a view or a custom query from a database | Pro |
Use Sample Data | A built-in 300-row housing file | Free |
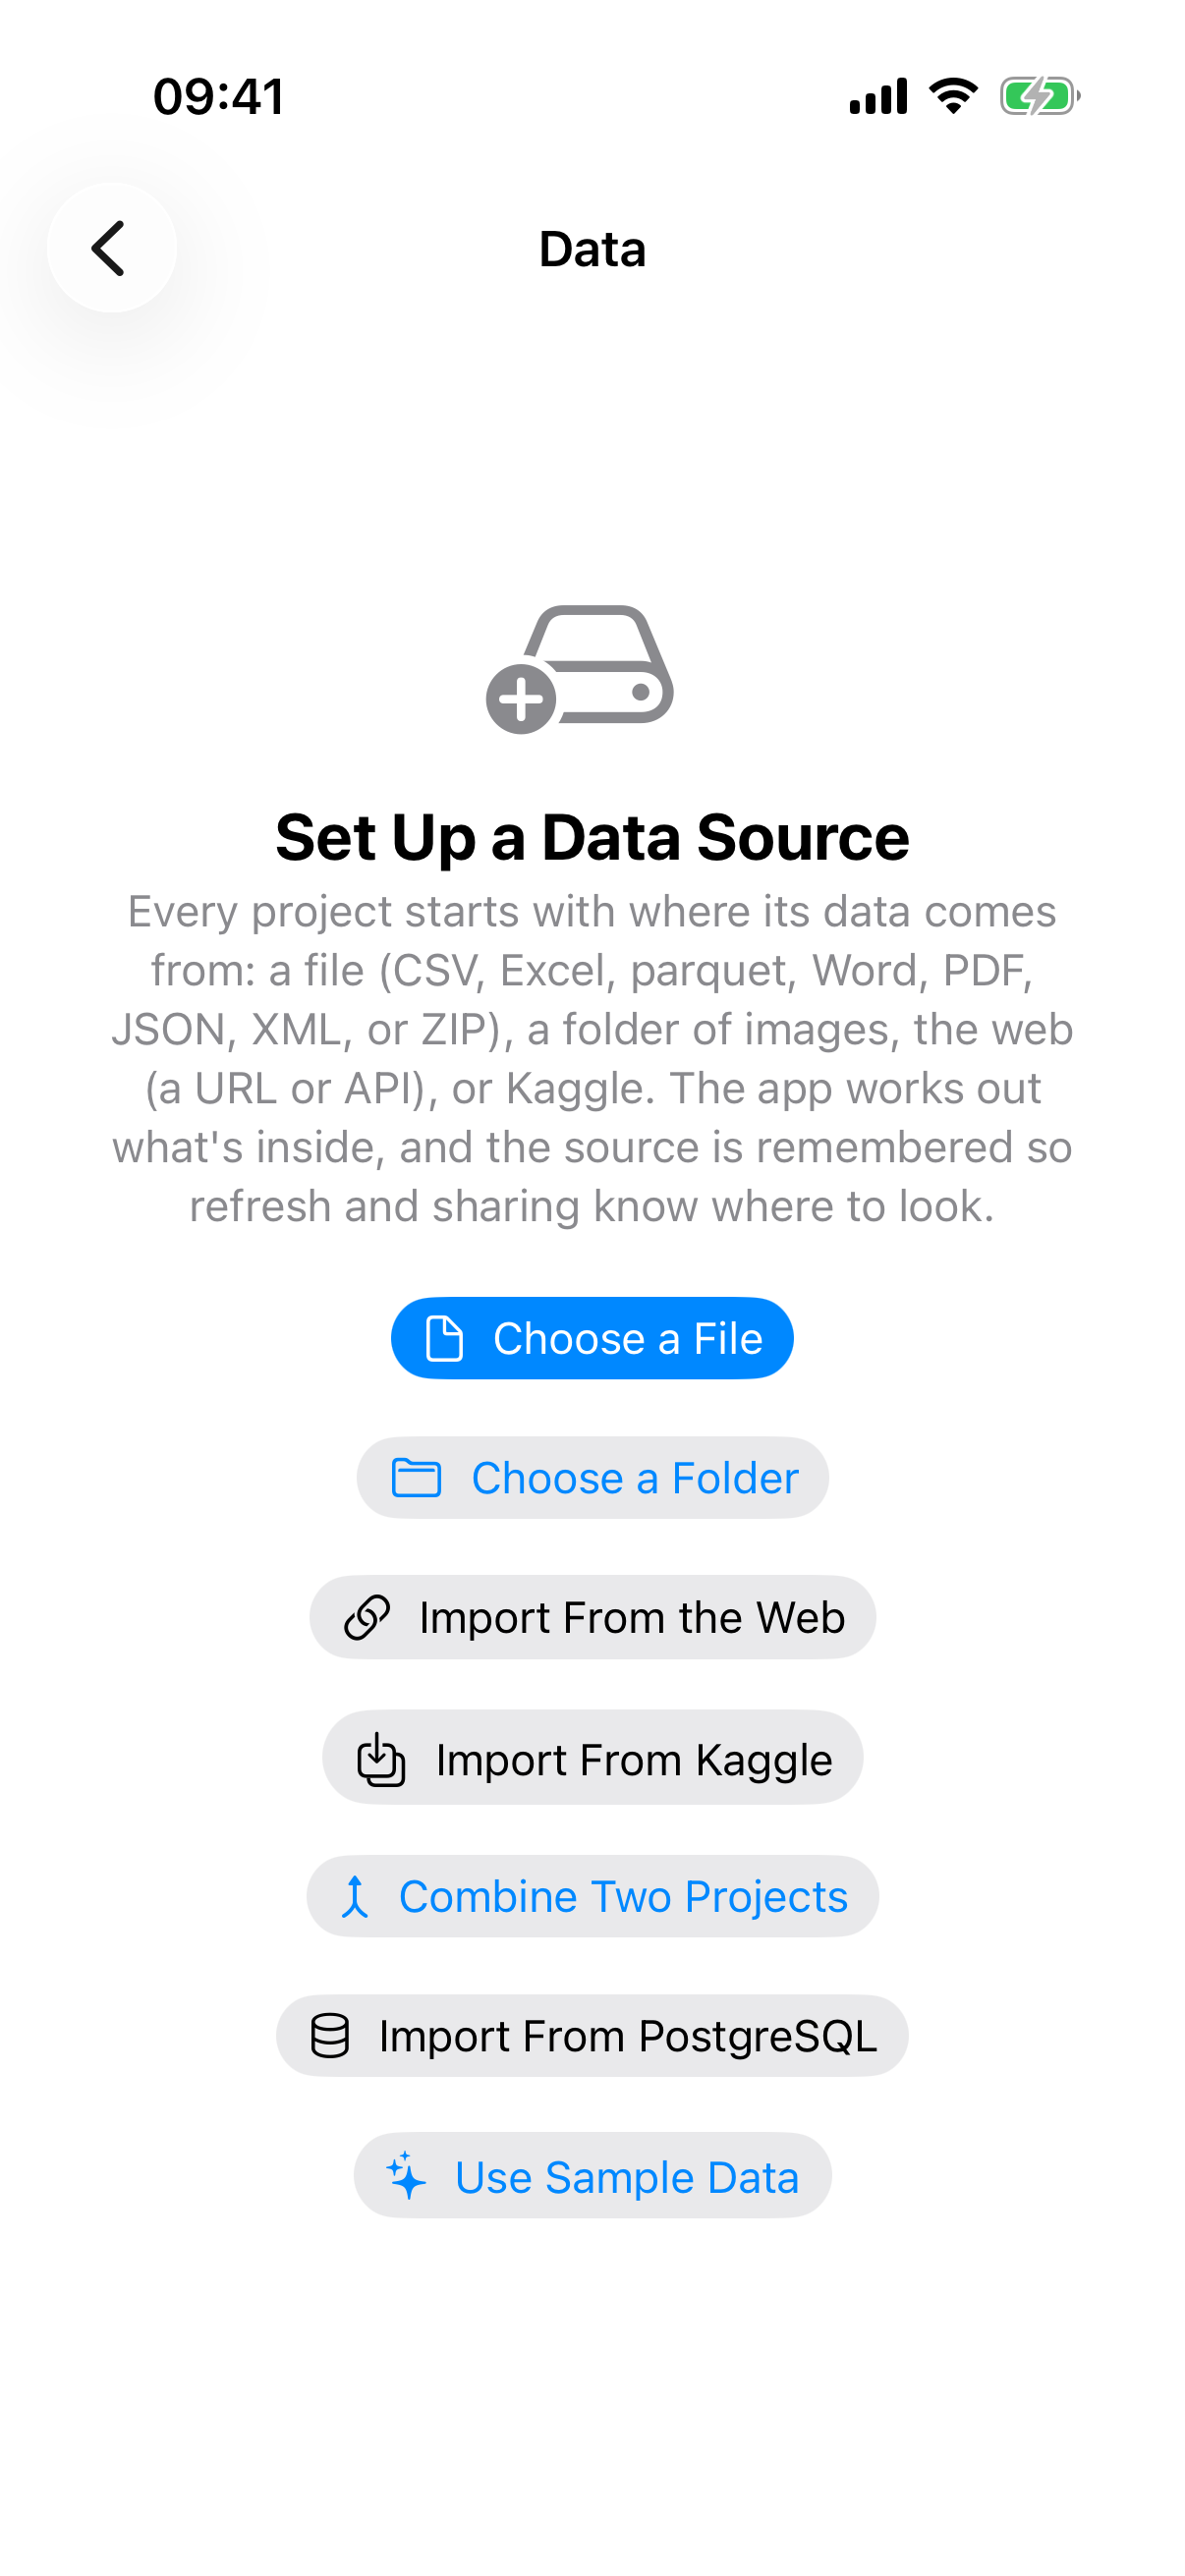
Set Up a Data Source: seven ways in.
The quickest route: sample data
Tap Use Sample Data and the app imports a 300-row file of house sales with eight columns: sqft, bedrooms, bathrooms, age_years, location, has_garden, listed_date and price. It has a few missing values and a mix of types on purpose, so it gives the cleaning tools and the trainer something to chew on. Every chapter that follows works with it.
Choose a File
Pick any supported file from Files, iCloud Drive or another provider. A few things happen without you being asked:
- The delimiter is sniffed. Comma, semicolon, tab and pipe are all counted on the first line and the winner is used. There is no delimiter picker anywhere in the app, because you should never need one.
- The header is sniffed too. If the first row is all numbers the file is treated as headerless and the columns are named col_1, col_2 and so on, the way pandas does it.
- There is no row limit. Rows stream into a local database in batches, so a ten-million-row CSV imports without the app ever holding it all in memory. It takes a while, and a progress bar with a Cancel button keeps you company.
Quoted fields, embedded newlines, Windows line endings and byte order marks are all handled. A ZIP is opened and searched. Excel workbooks, Word documents and PDFs go through an extra step, described next.
Files with more than one table in them
A workbook with several sheets, a Word document with several tables, a PDF, or a ZIP of files opens a sheet titled What to Import? Each table gets a Use for choice of Combine Into Data or Hold Out for Testing. Held-out tables stay separate so you can score a trained model against them later, which is a lovely habit to get into.
A ZIP of same-shaped files has a section called All of Them Together. Tap Combine All into One Dataset and every file is stacked into one table with a first column recording which file each row came from. Columns are matched by name, so a column one file lacks is simply left empty on that file's rows.
PDFs are read, not photographed
Word and PDF import read the document's own text. There is no optical character recognition, so a scanned PDF is refused rather than guessed at. A table that runs over a page break is stitched back into one, and repeating headers are kept once.
What you see after the import
The Data screen fills up. From the top: a File section with the row and column counts, a row of actions including View Data and Export Cleaned CSV, the Data Source row, a Columns list you can tap into, an Analysis section with the correlation matrix, pair plots and statistical tests, a Dataset Cleaning menu, and further down the Recipe and the held-out test files.
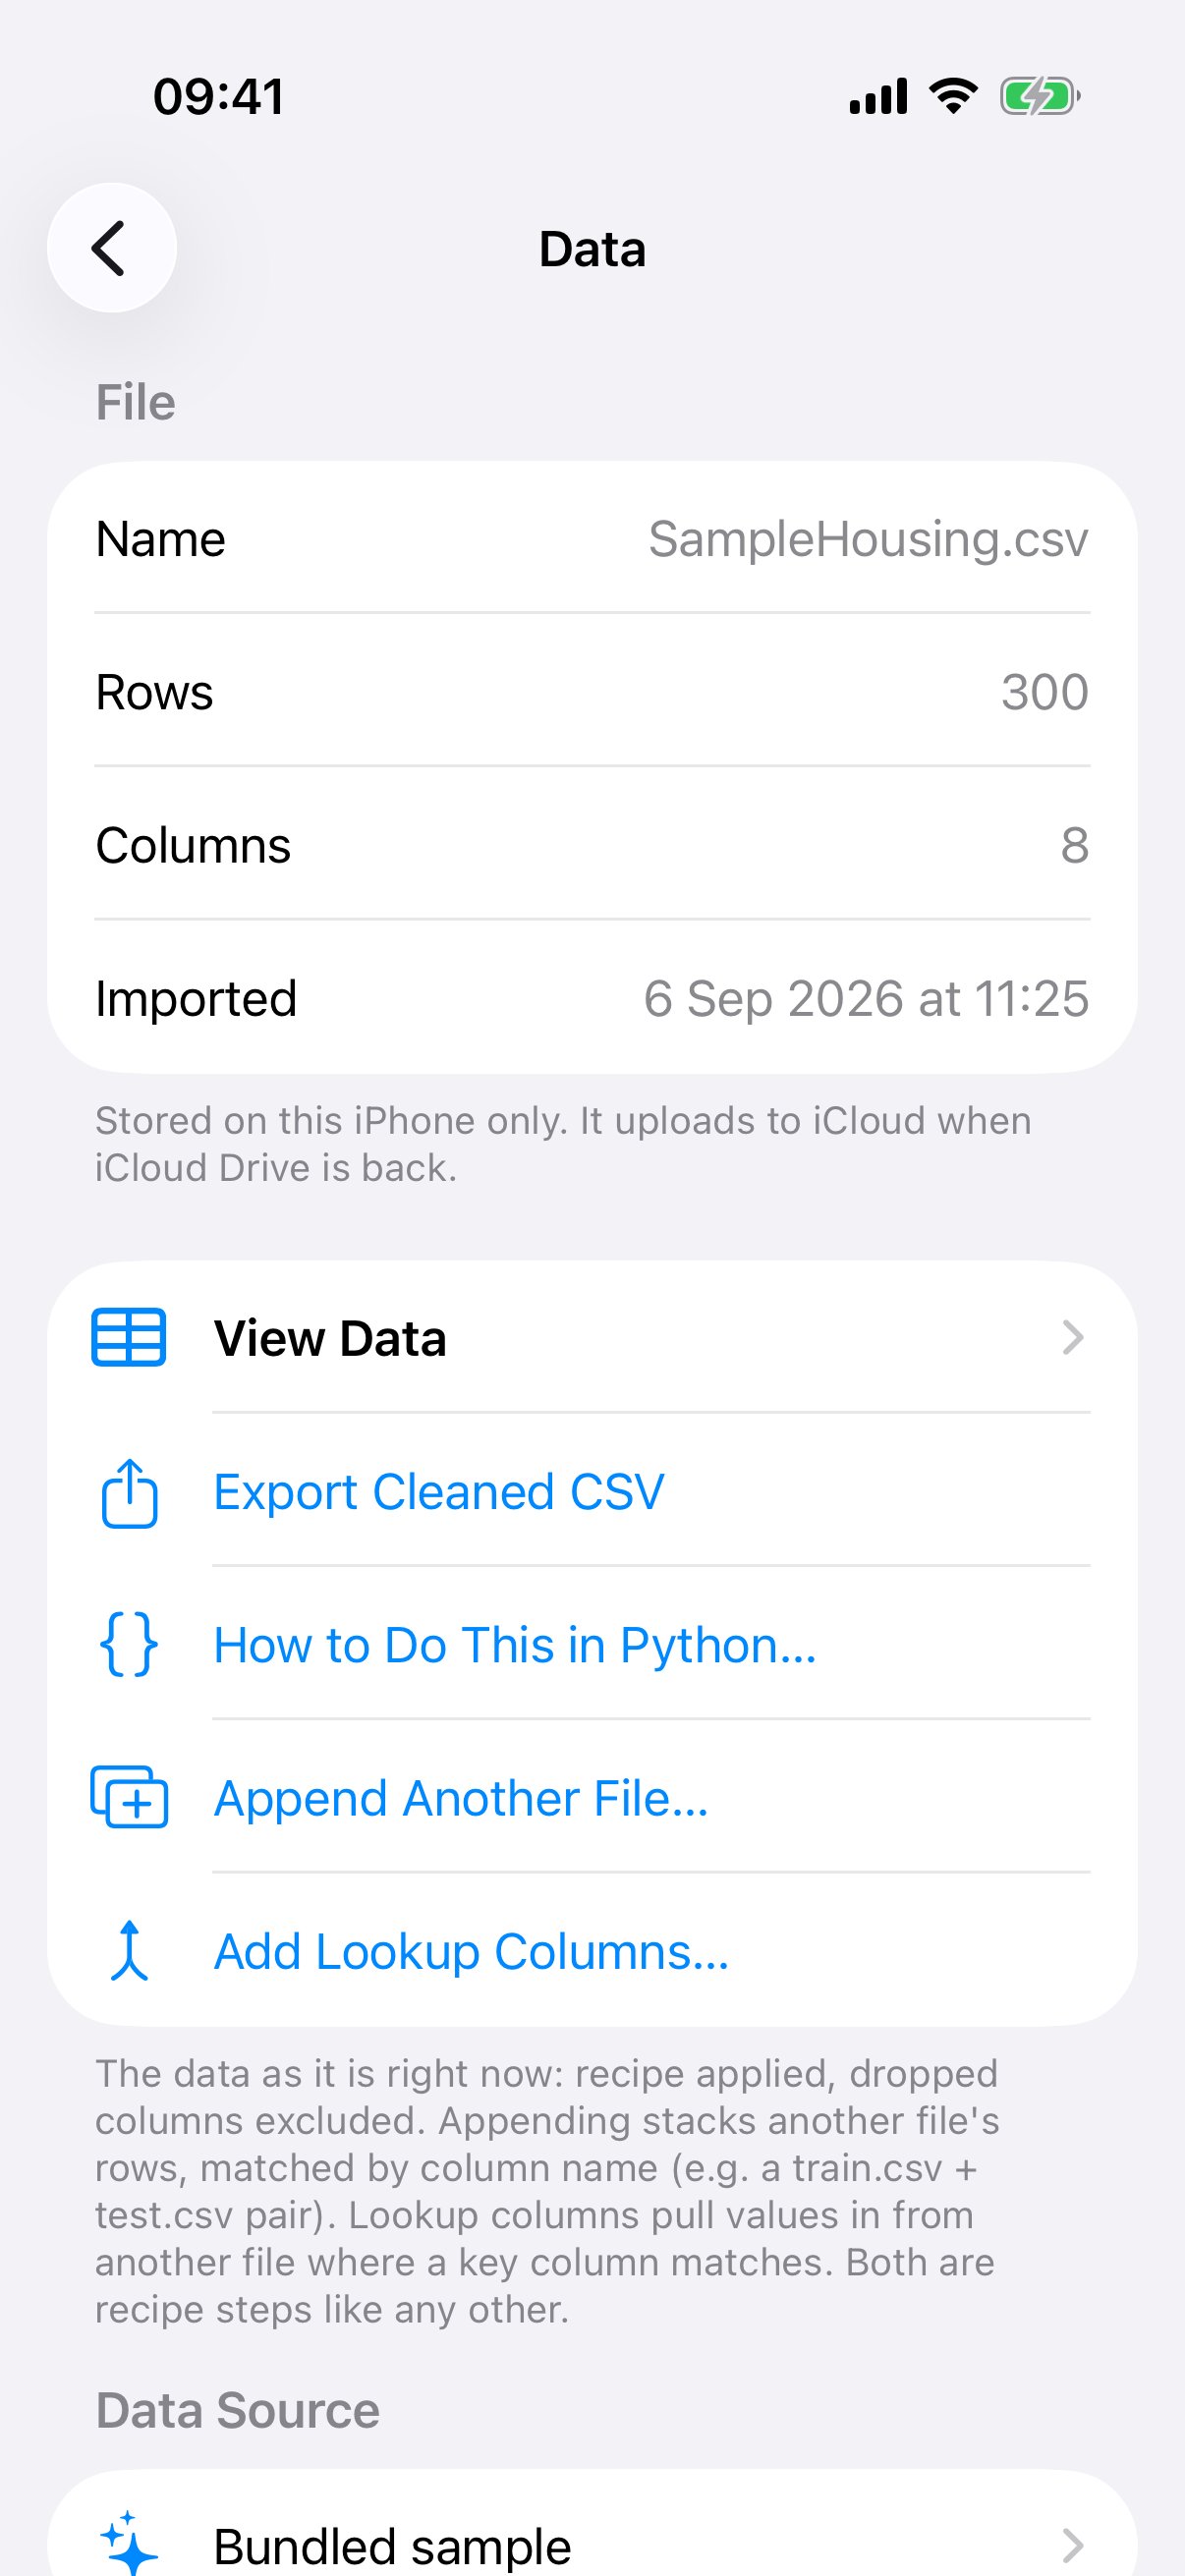
The Data screen after importing the sample data.
That is a lot of screen, and the next chapters take it a section at a time. If you would rather skip ahead and train something, go to the chapter on regression now. The sample data is ready for it as it stands.