Pair grid
Seaborn basics
1 min read
This section is 1 min read, full guide is 42 min read
Published Oct 7 2025
24
Show sections list
0
Log in to enable the "Like" button
0
Guide comments
0
Log in to enable the "Save" button
Respond to this guide
Guide Sections
Guide Comments
ChartsGraphsMatplotlibNumPyPandasPythonSeabornVisualisation
seaborn.PairGrid() creates a matrix of subplots (like pairplot()) to show pairwise relationships between multiple variables.
It’s the lower-level, fully customisable version of sns.pairplot().
You can:
- Control what kind of plot appears in each section (upper, lower, diagonal)
- Add custom plots or transformations
- Mix multiple plot types in one grid
Syntax:
sns.PairGrid(
data,
*,
vars=None,
x_vars=None,
y_vars=None,
hue=None,
palette=None,
hue_kws=None,
corner=False,
diag_sharey=True,
height=2.5,
aspect=1,
despine=True,
dropna=True,
)
Copy to Clipboard
Parameters:
data= DataFrame containing the datavars= List of variables to include (both x and y)x_vars,y_vars= Separate lists for asymmetric gridshue= Variable for colour groupingpalette= Colour palette for huecorner= If True, show only lower triangleheight= Height (inches) of each subplotaspect= Aspect ratio of each subplotdiag_sharey= Share y-axis across diagonal plotsdespine= Remove spines for cleaner look
Add different plots to diagonal and off-diagonal
import seaborn as sns
import matplotlib.pyplot as plt
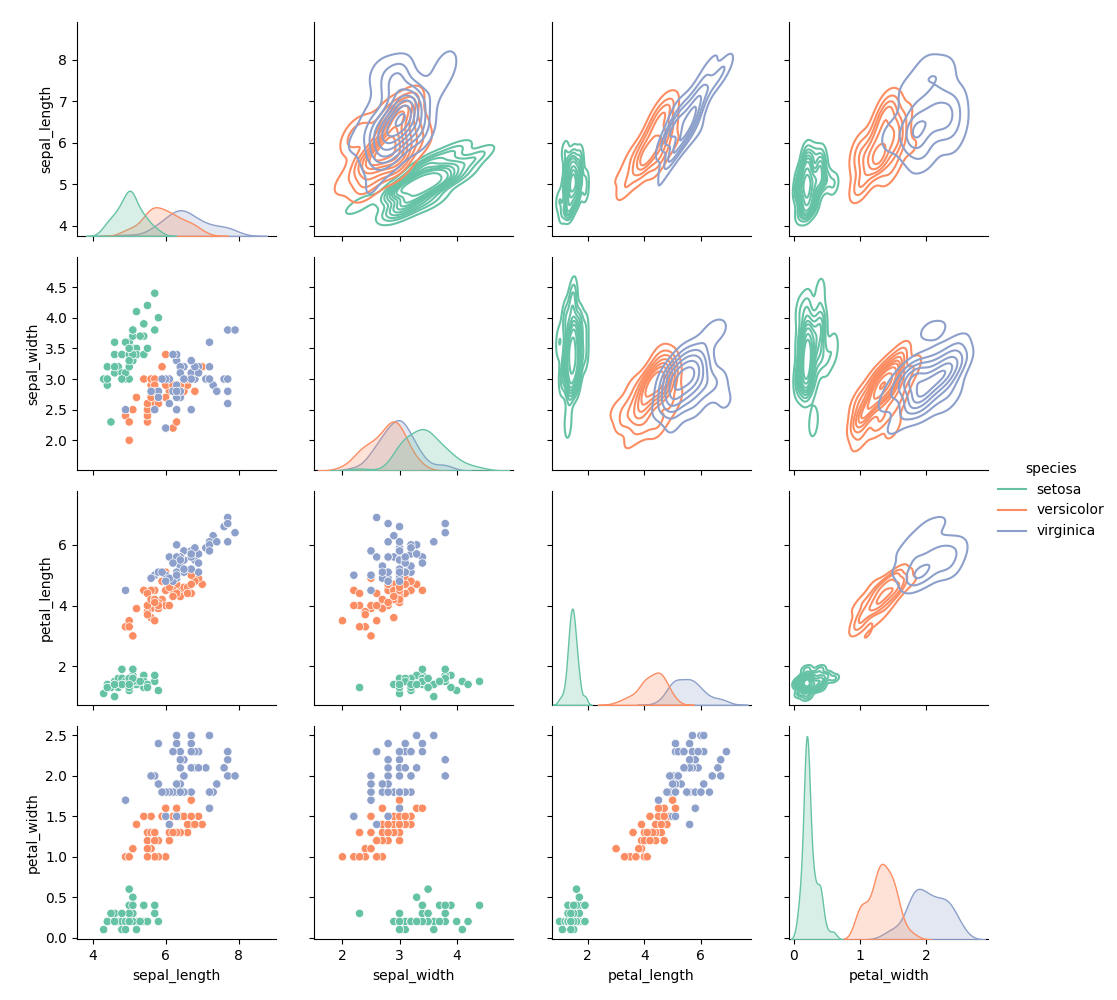
iris = sns.load_dataset("iris")
g = sns.PairGrid(iris, hue="species", palette="Set2")
g.map_lower(sns.scatterplot)
g.map_diag(sns.kdeplot, fill=True)
g.map_upper(sns.kdeplot)
g.add_legend()
plt.show()
Copy to Clipboard
- Lower triangle = scatterplots
- Upper triangle = KDE contours
- Diagonal = smoothed KDE of each variable
- Adds legend automatically
Products from our shop
Docker Cheat Sheet - Print at Home Designs

Docker Cheat Sheet Mouse Mat

Docker Cheat Sheet Travel Mug

Docker Cheat Sheet Mug
Vim Cheat Sheet - Print at Home Designs

Vim Cheat Sheet Mouse Mat

Vim Cheat Sheet Travel Mug

Vim Cheat Sheet Mug

SimpleSteps.guide branded Travel Mug

Developer Excuse Javascript - Travel Mug

Developer Excuse Javascript Embroidered T-Shirt - Dark

Developer Excuse Javascript Embroidered T-Shirt - Light

Developer Excuse Javascript Mug - White

Developer Excuse Javascript Mug - Black

SimpleSteps.guide branded stainless steel water bottle

Developer Excuse Javascript Hoodie - Light
