Pair plot
Seaborn basics
2 min read
Published Oct 7 2025
Guide Sections
Guide Comments
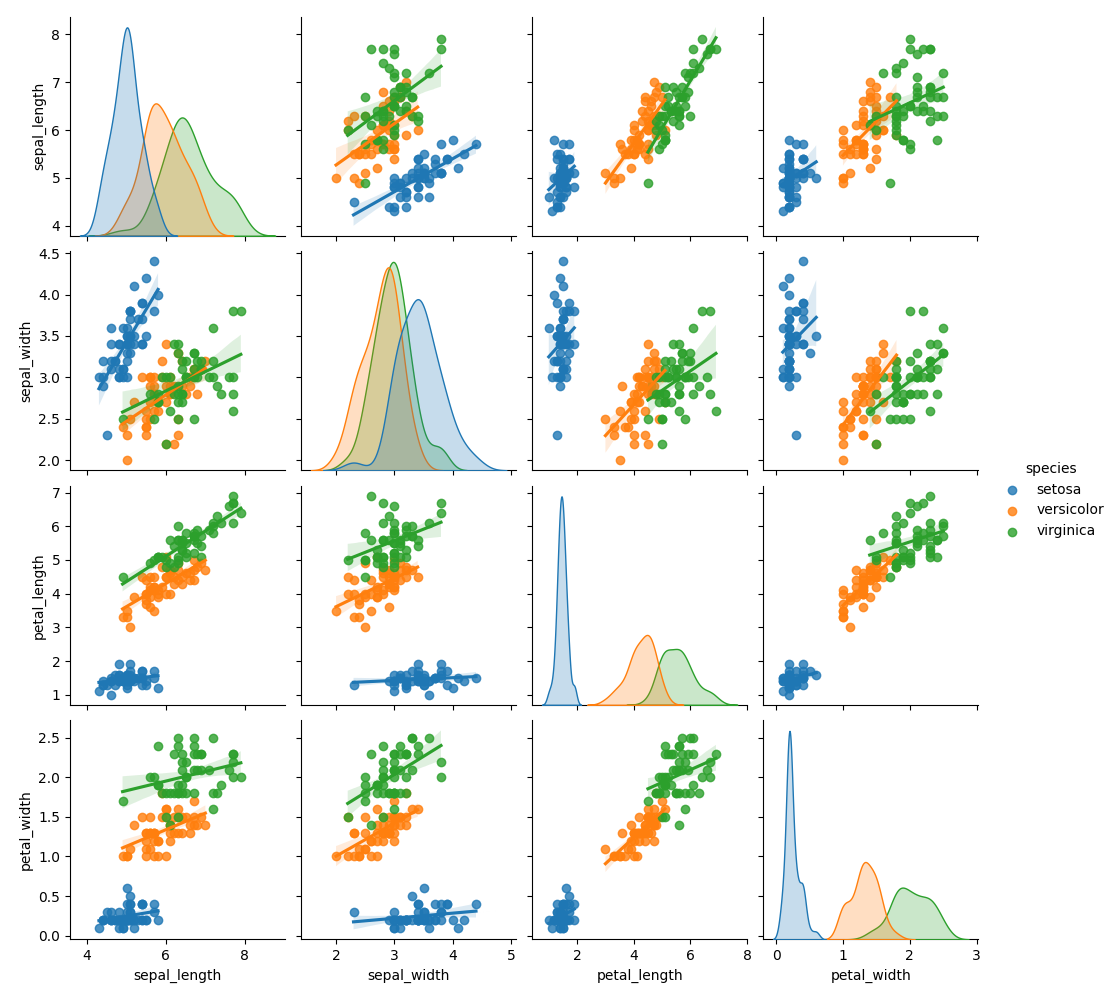
seaborn.pairplot() creates a grid of scatterplots and histograms (or KDEs) for pairwise relationships between numeric variables in a dataset.
It’s one of Seaborn’s most powerful exploratory tools, showing how each variable:
- correlates with others (scatterplots), and
- distributes individually (histograms or density plots on the diagonal).
Syntax:
Parameters:
data= DataFrame with numeric columnshue= Variable to colour-code data points by categoryvars= List of variables to include (both x and y)x_vars,y_vars= Lists of variables for x and y axes (for asymmetric grids)kind= Plot type: "scatter" (default) or "kde"diag_kind= Plot type on the diagonal: "auto", "hist", or "kde"markers= Marker style for scatterplotspalette= Colour palette for hue categoriescorner= If True, show only the lower triangle of plotsplot_kws,diag_kws,grid_kws= Keyword arguments for customising subplotsheight= Height (in inches) of each subplotaspect= Aspect ratio of each subplotdropna= Whether to drop missing valuescontext= Set a plotting context (e.g., "talk", "notebook")
Basic example
Creates a scatterplot matrix for all numeric columns in iris. Diagonal = histograms of each variable. Off-diagonal = pairwise scatterplots.

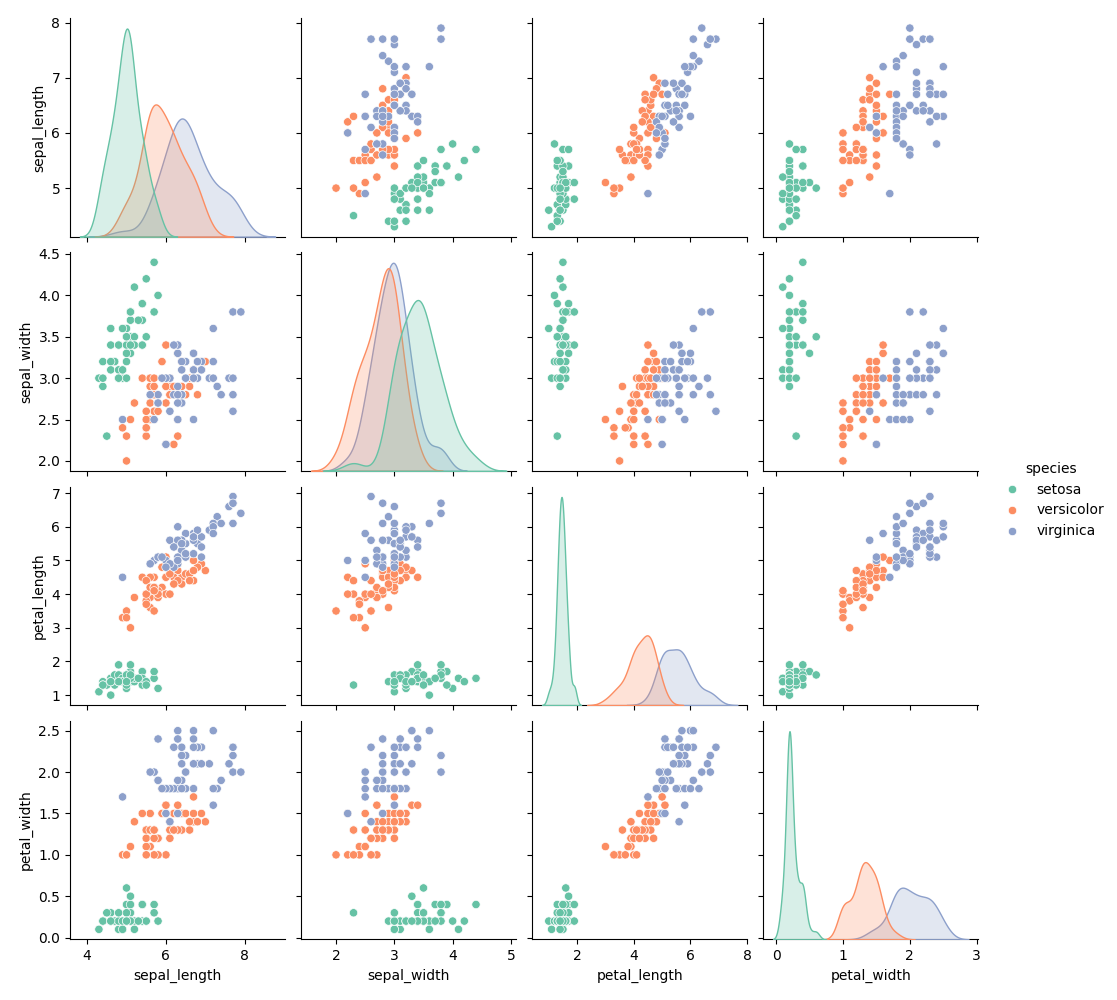
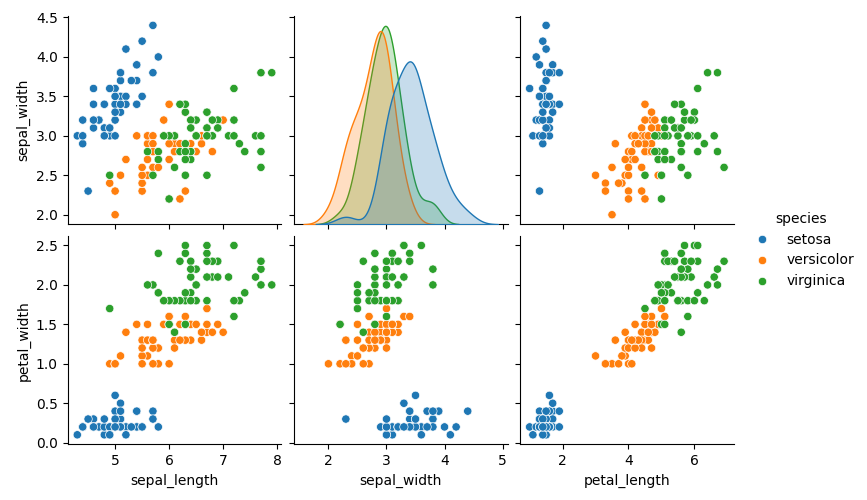
Add hue (colour by category)
Colours each species differently. Great for class separation or cluster analysis.
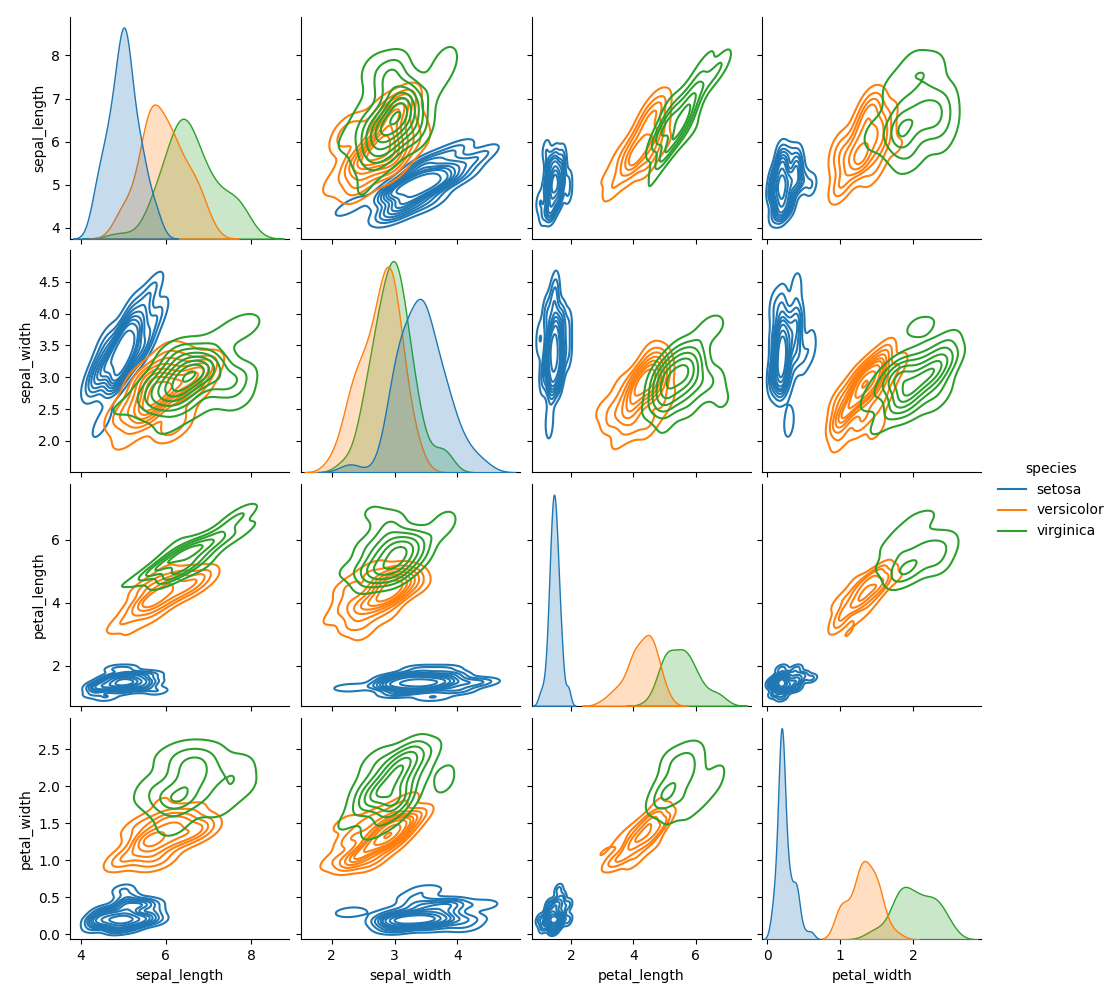
Use KDE instead of scatterplots
Shows smooth density contours instead of discrete points. Great for large datasets or overlapping points.
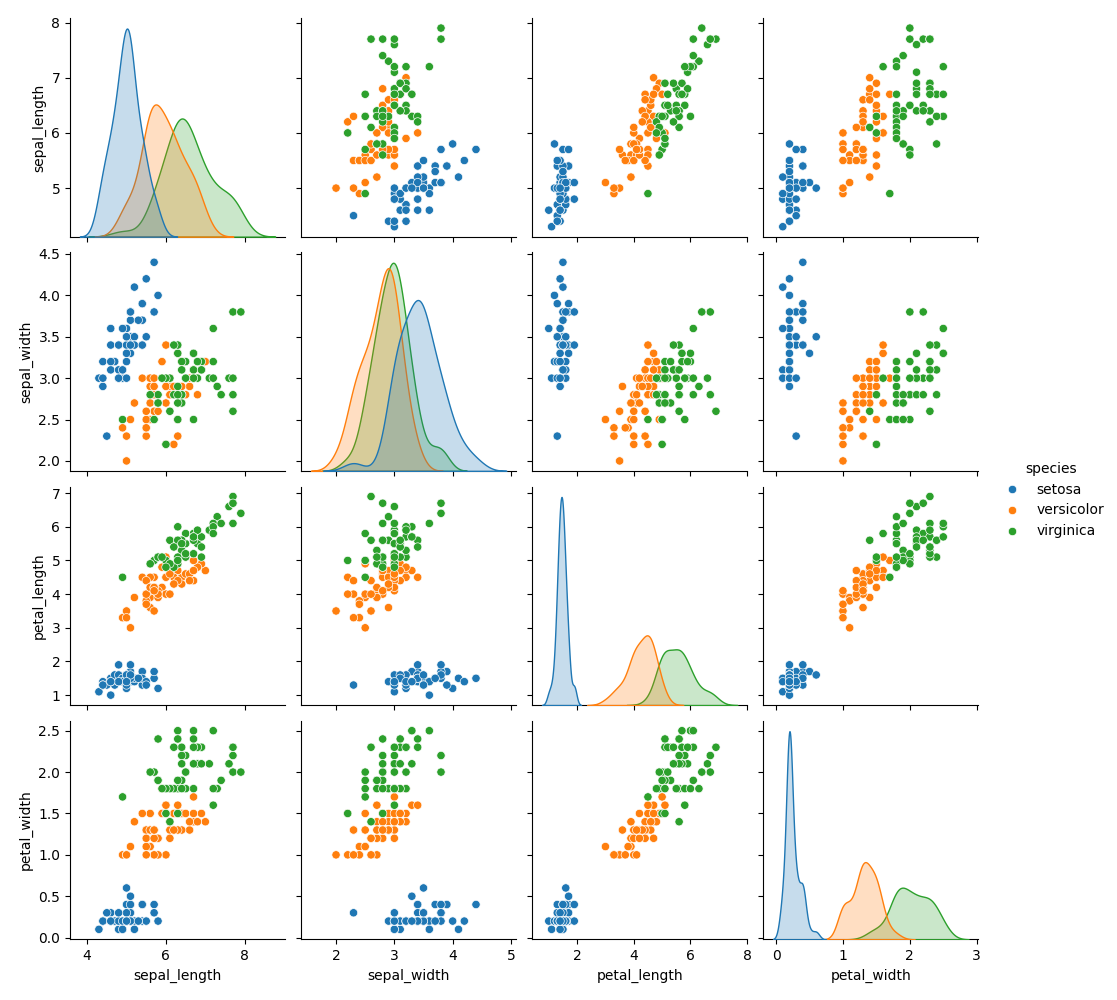
Change diagonal plot type
Replaces histograms on the diagonal with KDE (smoothed density) curves.
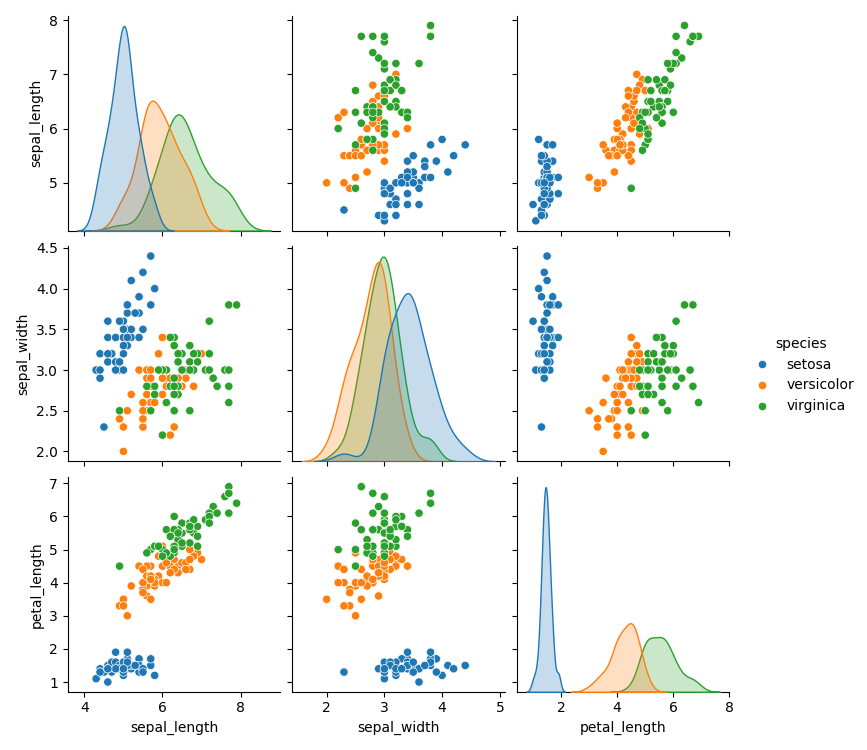
Select specific variables
Only plots relationships among selected columns. Useful for focusing on variables of interest.
Asymmetric grids (x_vars vs y_vars)
Creates a non-square grid — useful for comparing two sets of variables.
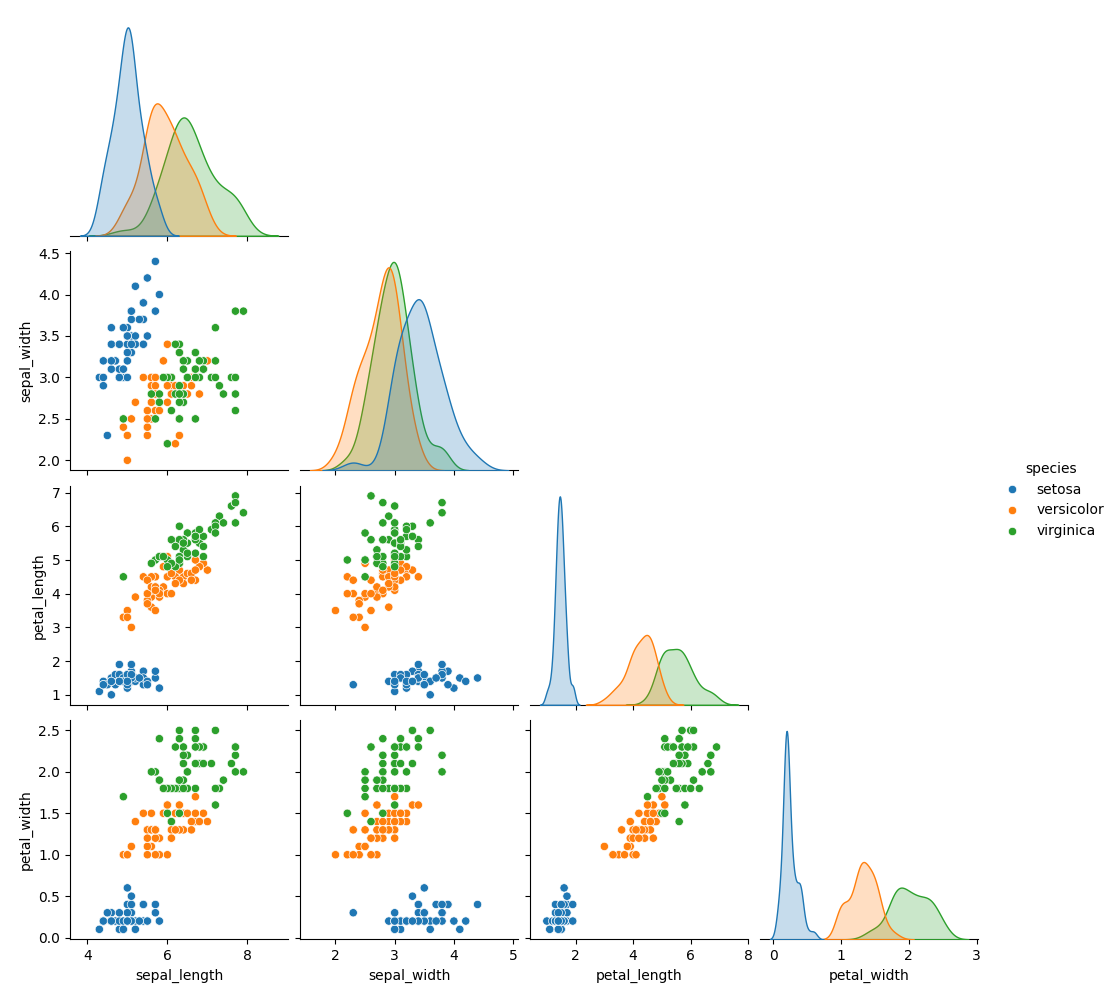
Show only lower triangle (corner)
Hides the upper triangle, reducing redundancy. Common in publications for clarity.
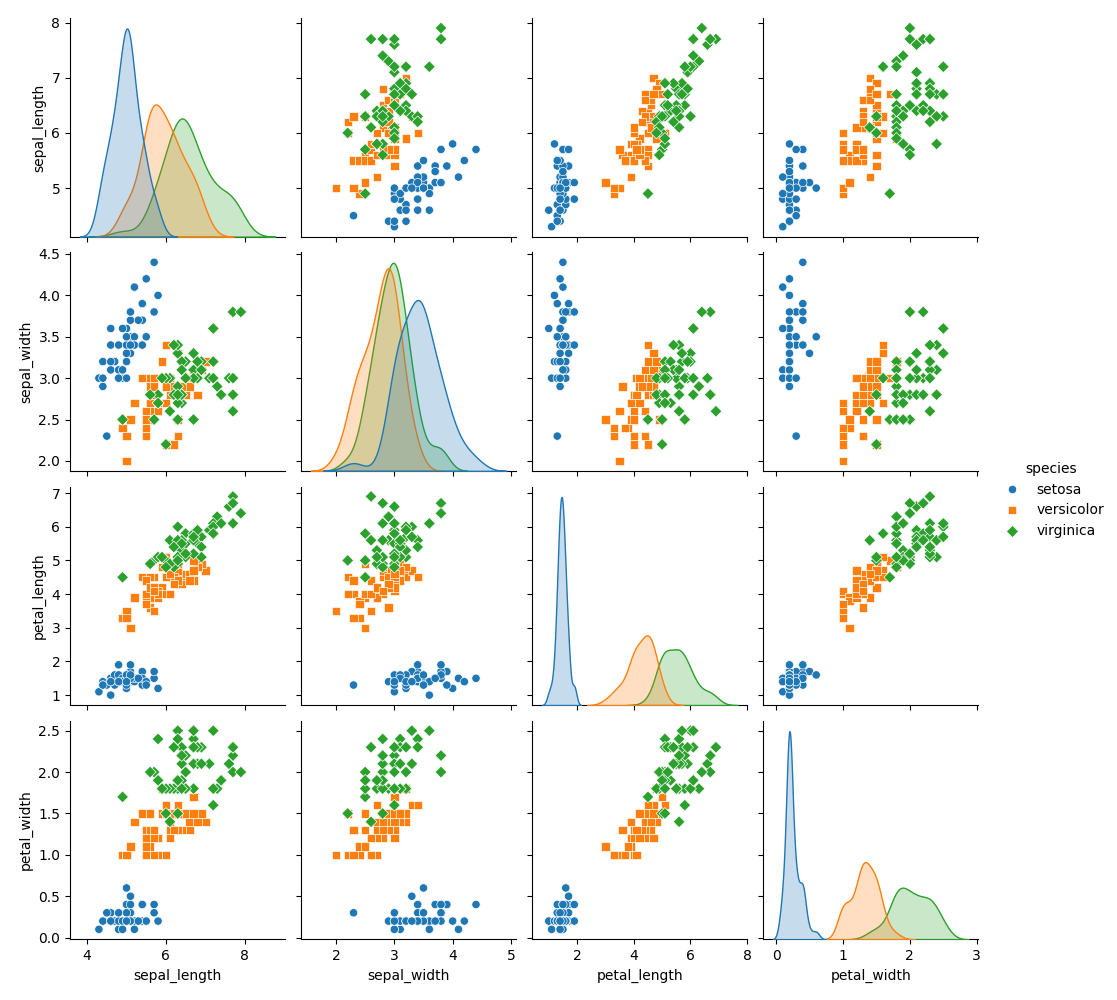
Change marker style
Uses different marker shapes for each category in hue.
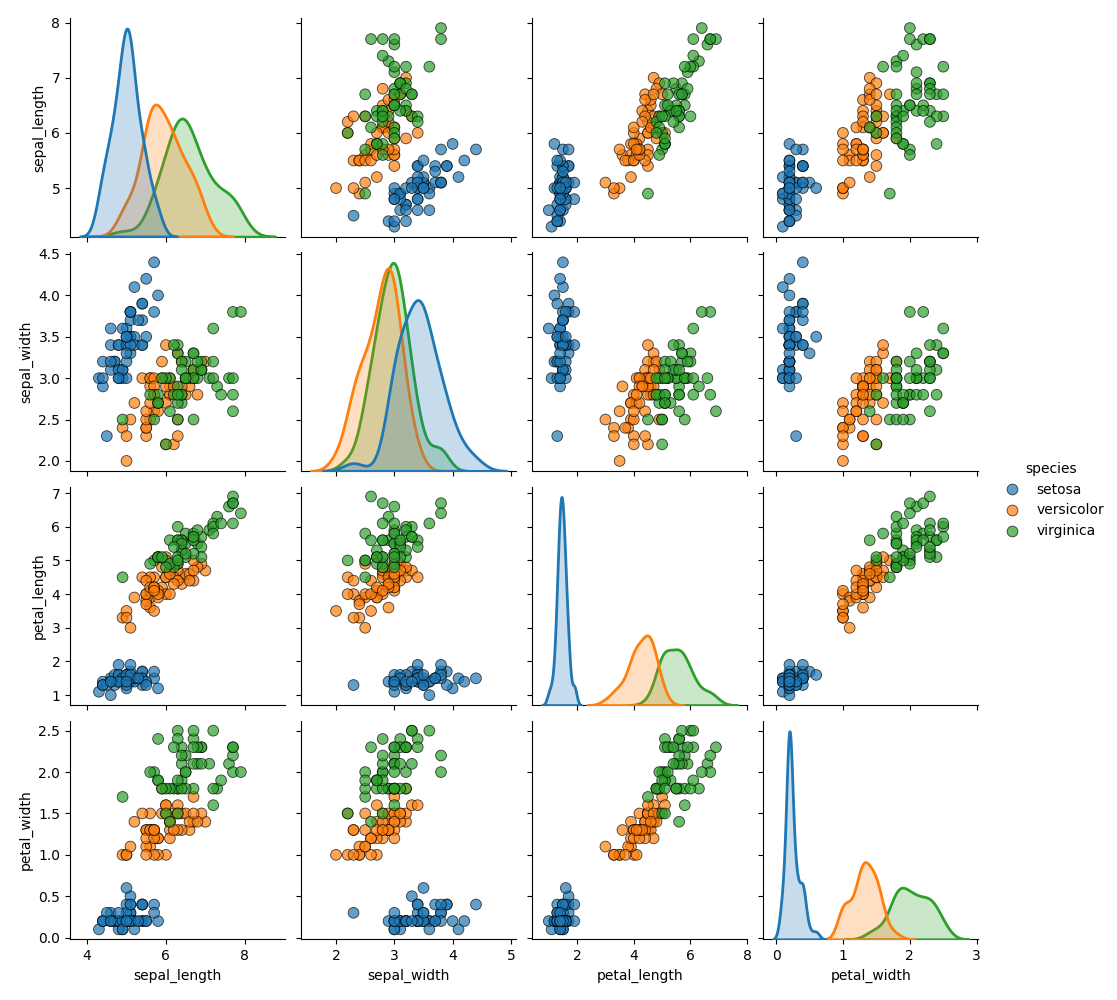
Pass custom plotting options
Adds transparency, size, and edges to scatter points. Smooths and thickens KDEs/histograms on the diagonal.
Pairplot with regression lines
Adds linear regression lines in each scatterplot. Equivalent to calling sns.lmplot() for every pair.
Products from our shop
Docker Cheat Sheet - Print at Home Designs

Docker Cheat Sheet Mouse Mat

Docker Cheat Sheet Travel Mug

Docker Cheat Sheet Mug
Vim Cheat Sheet - Print at Home Designs

Vim Cheat Sheet Mouse Mat

Vim Cheat Sheet Travel Mug

Vim Cheat Sheet Mug

SimpleSteps.guide branded Travel Mug

Developer Excuse Javascript - Travel Mug

Developer Excuse Javascript Embroidered T-Shirt - Dark

Developer Excuse Javascript Embroidered T-Shirt - Light

Developer Excuse Javascript Mug - White

Developer Excuse Javascript Mug - Black

SimpleSteps.guide branded stainless steel water bottle

Developer Excuse Javascript Hoodie - Light
