Scatter plots
Seaborn basics
1 min read
This section is 1 min read, full guide is 42 min read
Published Oct 7 2025
24
Show sections list
0
Log in to enable the "Like" button
0
Guide comments
0
Log in to enable the "Save" button
Respond to this guide
Guide Sections
Guide Comments
ChartsGraphsMatplotlibNumPyPandasPythonSeabornVisualisation
seaborn.scatterplot() is used to create scatter plots in Python. Scatter plots are great for visualising the relationship between two numerical variables, optionally with additional categorical information using colour, size, or style.
Syntax:
sns.scatterplot(
data=None,
x=None,
y=None,
hue=None,
style=None,
size=None,
palette=None,
markers=True,
sizes=None,
**kwargs
)
Copy to Clipboard
Parameters:
data→ DataFrame containing the data.x,y→ Columns to plot on X and Y axes.hue→ Column name for colour encoding (categorical or numeric).style→ Column for marker shapes.size→ Column to scale marker sizes.palette→ Colours for hue categories.markers→ Whether to use different marker shapes.sizes→ Range of sizes for markers.
Basic example
import seaborn as sns
import matplotlib.pyplot as plt
# Sample data
data = sns.load_dataset("iris")
# Simple scatter plot
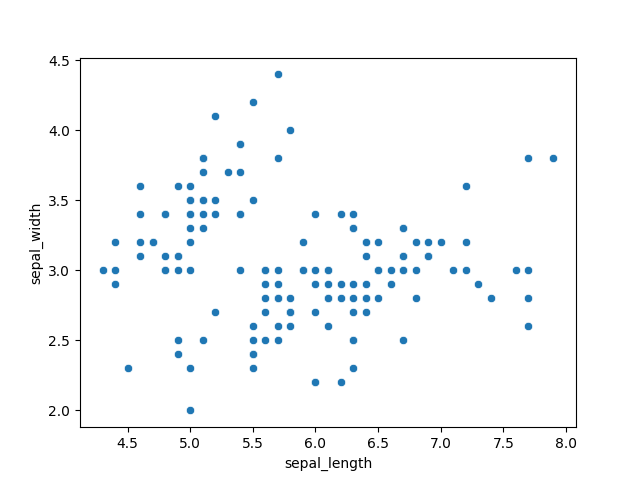
sns.scatterplot(data=data, x="sepal_length", y="sepal_width")
plt.show()
Copy to Clipboard
Toggle show comments
This will plot sepal length vs. sepal width for all iris flowers.
Using hue (colour)
import seaborn as sns
import matplotlib.pyplot as plt
data = sns.load_dataset("iris")
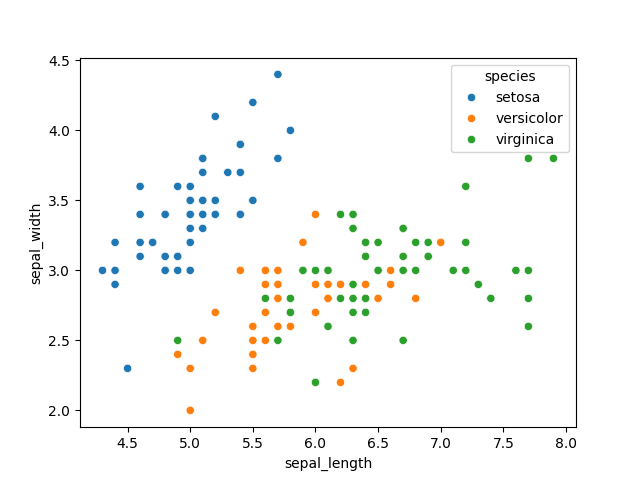
sns.scatterplot(data=data, x="sepal_length", y="sepal_width", hue="species")
plt.show()
Copy to Clipboard
Points are coloured by species.
Using style and size
import seaborn as sns
import matplotlib.pyplot as plt
data = sns.load_dataset("iris")
sns.scatterplot(
data=data,
x="sepal_length",
y="sepal_width",
hue="species",
style="species",
size="petal_length",
sizes=(20, 200)
)
plt.show()
Copy to Clipboard
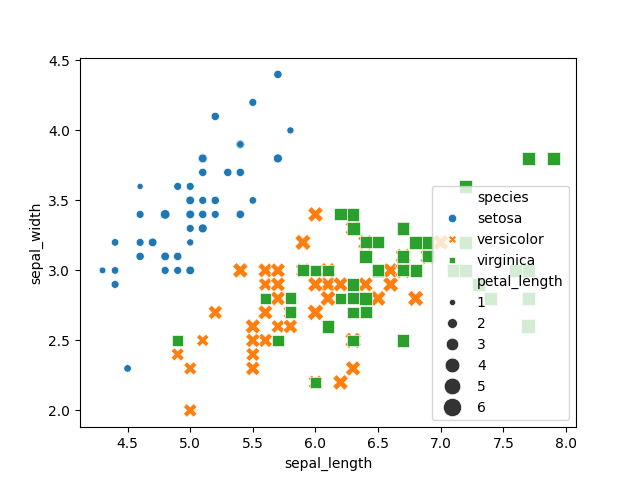
- Style: different marker shapes for species.
- Size: marker sizes proportional to petal length.
Customising appearance
import seaborn as sns
import matplotlib.pyplot as plt
data = sns.load_dataset("iris")
sns.scatterplot(
data=data,
x="sepal_length",
y="sepal_width",
hue="species",
palette="bright",
s=100,
edgecolor="black"
)
plt.show()
Copy to Clipboard
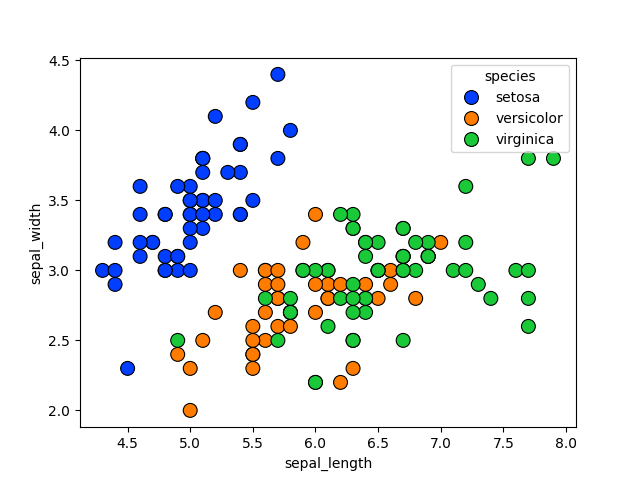
palette="bright"→ colorful markerss=100→ marker sizeedgecolor="black"→ black border around markers
Products from our shop
Docker Cheat Sheet - Print at Home Designs

Docker Cheat Sheet Mouse Mat

Docker Cheat Sheet Travel Mug

Docker Cheat Sheet Mug
Vim Cheat Sheet - Print at Home Designs

Vim Cheat Sheet Mouse Mat

Vim Cheat Sheet Travel Mug

Vim Cheat Sheet Mug

SimpleSteps.guide branded Travel Mug

Developer Excuse Javascript - Travel Mug

Developer Excuse Javascript Embroidered T-Shirt - Dark

Developer Excuse Javascript Embroidered T-Shirt - Light

Developer Excuse Javascript Mug - White

Developer Excuse Javascript Mug - Black

SimpleSteps.guide branded stainless steel water bottle

Developer Excuse Javascript Hoodie - Light
